| Type of inventory | What it is | Why it is held |
|---|---|---|
| Raw materials and components | Inputs bought from suppliers but not yet used | So production is never stopped by a late delivery; to buy in bulk at lower prices |
| Work in progress (WIP) | Partly finished products still in the production process | Unavoidable in most processes; allows different stages to work at different speeds |
| Finished products | Completed goods waiting to be sold or delivered | To meet customer orders immediately, including unexpected or seasonal demand |
| Benefits of holding inventory | Costs of holding inventory |
|---|---|
| Production can continue if a supplier delivers late | Opportunity cost: cash tied up in inventory could be used elsewhere or earn interest |
| Customer orders, including sudden increases in demand, can be met immediately — no lost sales | Storage costs: warehouse space, rent, security, refrigeration, insurance |
| Bulk buying earns discounts, lowering unit costs | Risk of waste: deterioration, damage, theft, and products going out of date or out of fashion (obsolescence) |
| Seasonal demand can be met by building inventory in quiet periods | Administration: staff and systems to record and manage inventory |
Holding too little inventory risks production stoppages, missed orders and dissatisfied customers (the costs of a stock-out). Holding too much ties up cash and raises storage and wastage costs. Inventory management is about finding the balance.
The re-order level is the level of inventory at which a new order is placed with the supplier. Lead time is the time between placing an order with a supplier and receiving the delivery. The re-order quantity is the amount of inventory ordered each time a new order is placed.
These are linked: the re-order level must be high enough that inventory does not fall below the buffer level during the lead time. Re-order level = (usage per period × lead time) + buffer inventory.
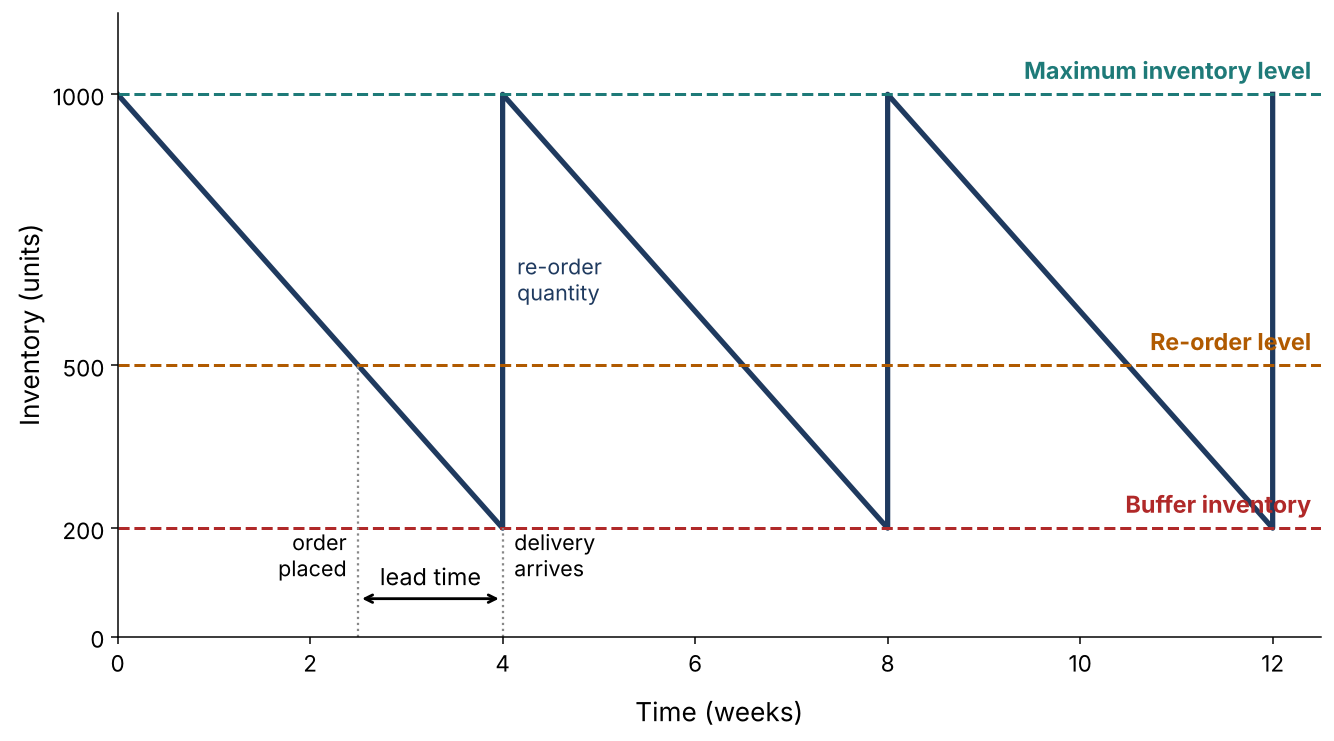
Reading Figure 1:
Maximum inventory level = 1 000 units; buffer inventory = 200 units
Usage rate: inventory falls from 1 000 to 200 (800 units) in 4 weeks = 200 units per week
Re-order level = 500 units, reached at week 2.5; delivery arrives at week 4, so lead time = 1.5 weeks
Check: usage during the lead time = 200 × 1.5 = 300 units; 500 − 300 = 200 = buffer level ✓
Re-order quantity = maximum level − buffer level = 1 000 − 200 = 800 units
Real inventory charts are rarely this regular. If usage suddenly rises or a delivery is late, inventory dips into the buffer; if both happen together, the business may run out. Charts help managers spot these risks and adjust the re-order level or buffer.
Supplier's lead time increases from 1.5 to 2.5 weeks → inventory used during the lead time rises to 500 units → if the re-order level stays at 500, inventory falls to zero before delivery → production stops — a stock-out → the business must raise its re-order level (to 700) or its buffer inventory
- choosing reliable suppliers that deliver the right quality on time, often building long-term partnerships
- sharing information with suppliers (sales forecasts, inventory levels) so they can plan production
- managing logistics — transport, warehousing and delivery to customers
- reducing risk — avoiding dependence on a single supplier or a single country
- using technology — real-time tracking, automated re-ordering, supplier portals
Effective SCM lowers inventory and transport costs, improves reliability, and lets businesses respond faster to customers. Weak SCM is exposed by disruptions — the global shortage of computer chips after 2020 halted car production around the world, showing how one missing component can stop an entire operation.
- 4.2.2 Just in Time (JIT)
- Exam practice: 5 practice questions
- 2 exemplar answers with full model answers and mark breakdowns
- Where students commonly lose marks