Level: SL and HL. Sections marked HL only are for Higher Level students.
Price elasticity of supply measures how quickly and how fully producers can respond when prices change. It explains why some prices swing wildly while others barely move.
Price elasticity of supply (PES) measures the responsiveness of quantity supplied of a good to a change in its price.
PES = percentage change in quantity supplied ÷ percentage change in price
Because price and quantity supplied move in the same direction, PES is positive.
| Value of PES | Description | Meaning |
|---|---|---|
| 0 | Perfectly inelastic | Quantity supplied does not change when price changes |
| Between 0 and 1 | Price inelastic | Quantity supplied changes by a smaller percentage than price |
| 1 | Unit elastic | Quantity supplied changes by the same percentage as price |
| Greater than 1 | Price elastic | Quantity supplied changes by a larger percentage than price |
| Infinity (∞) | Perfectly elastic | Producers will supply any quantity at the current price, but none below it |
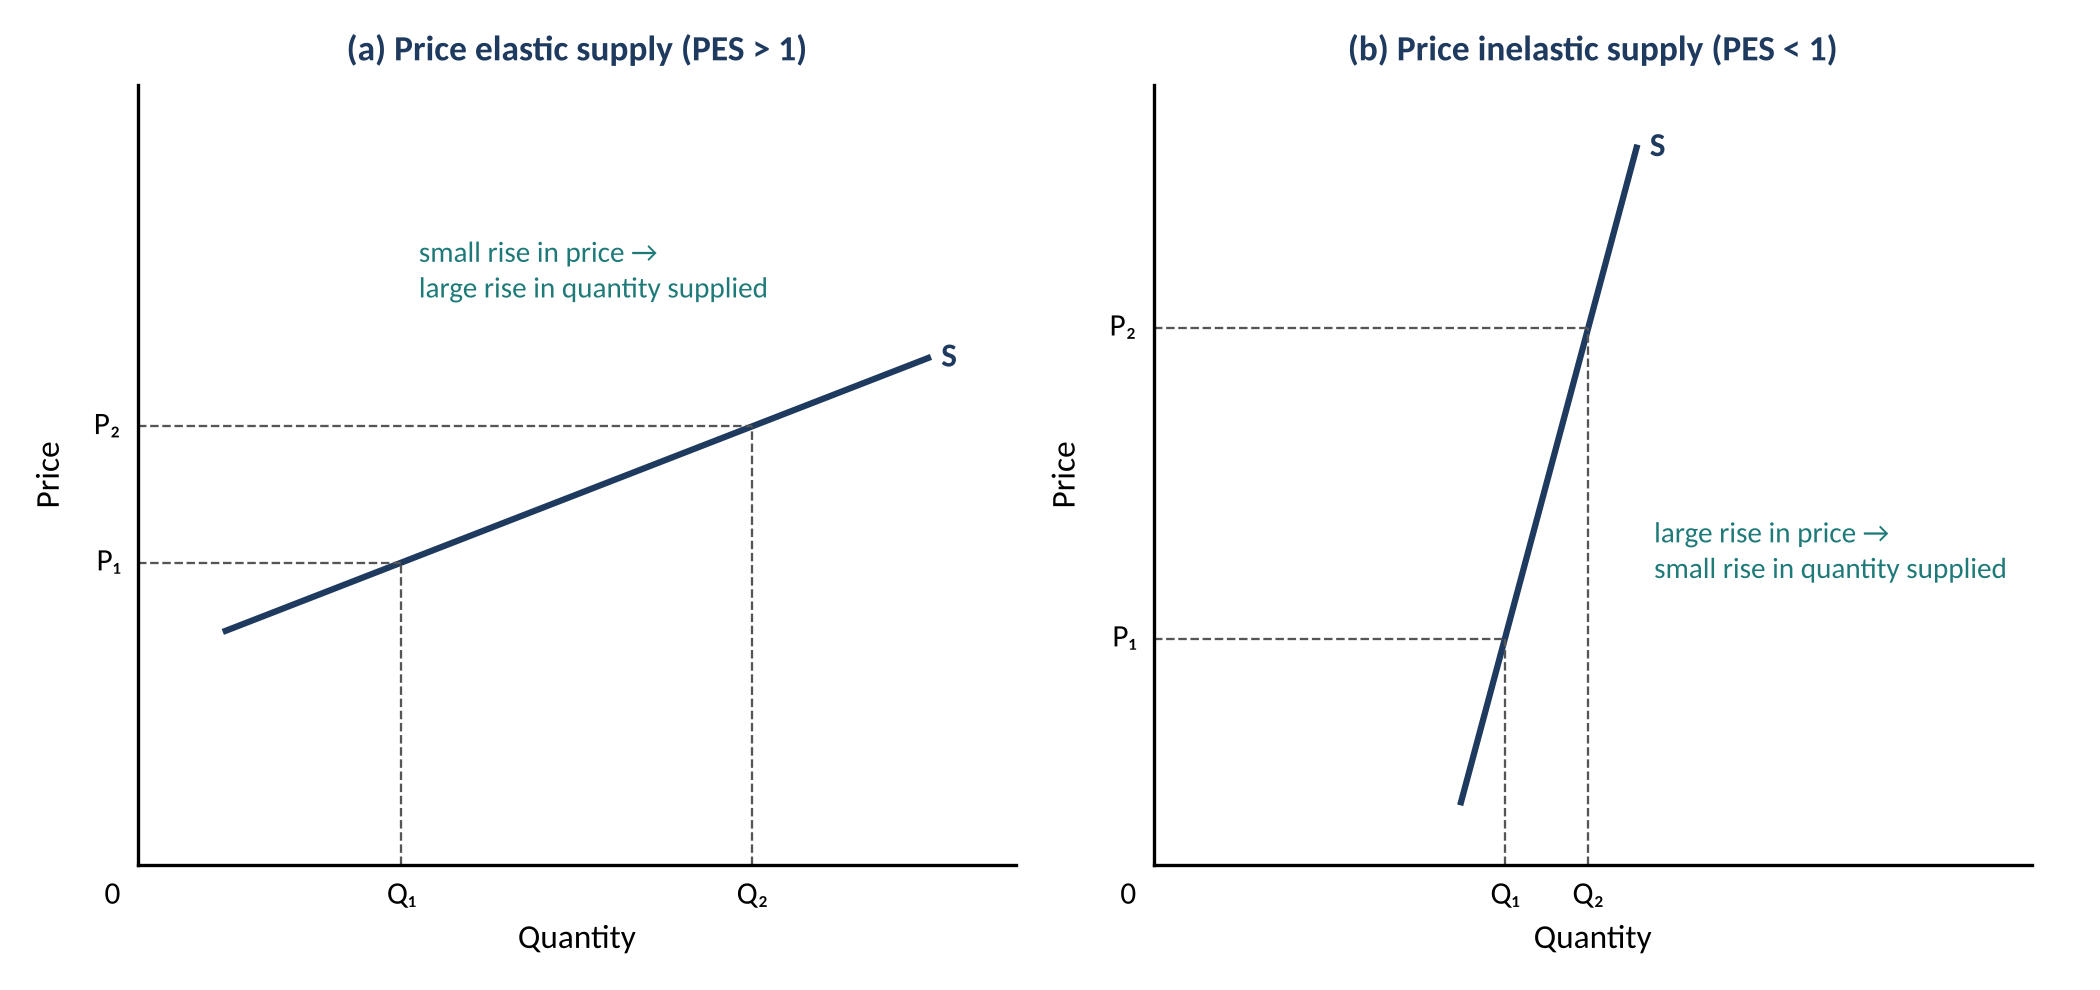
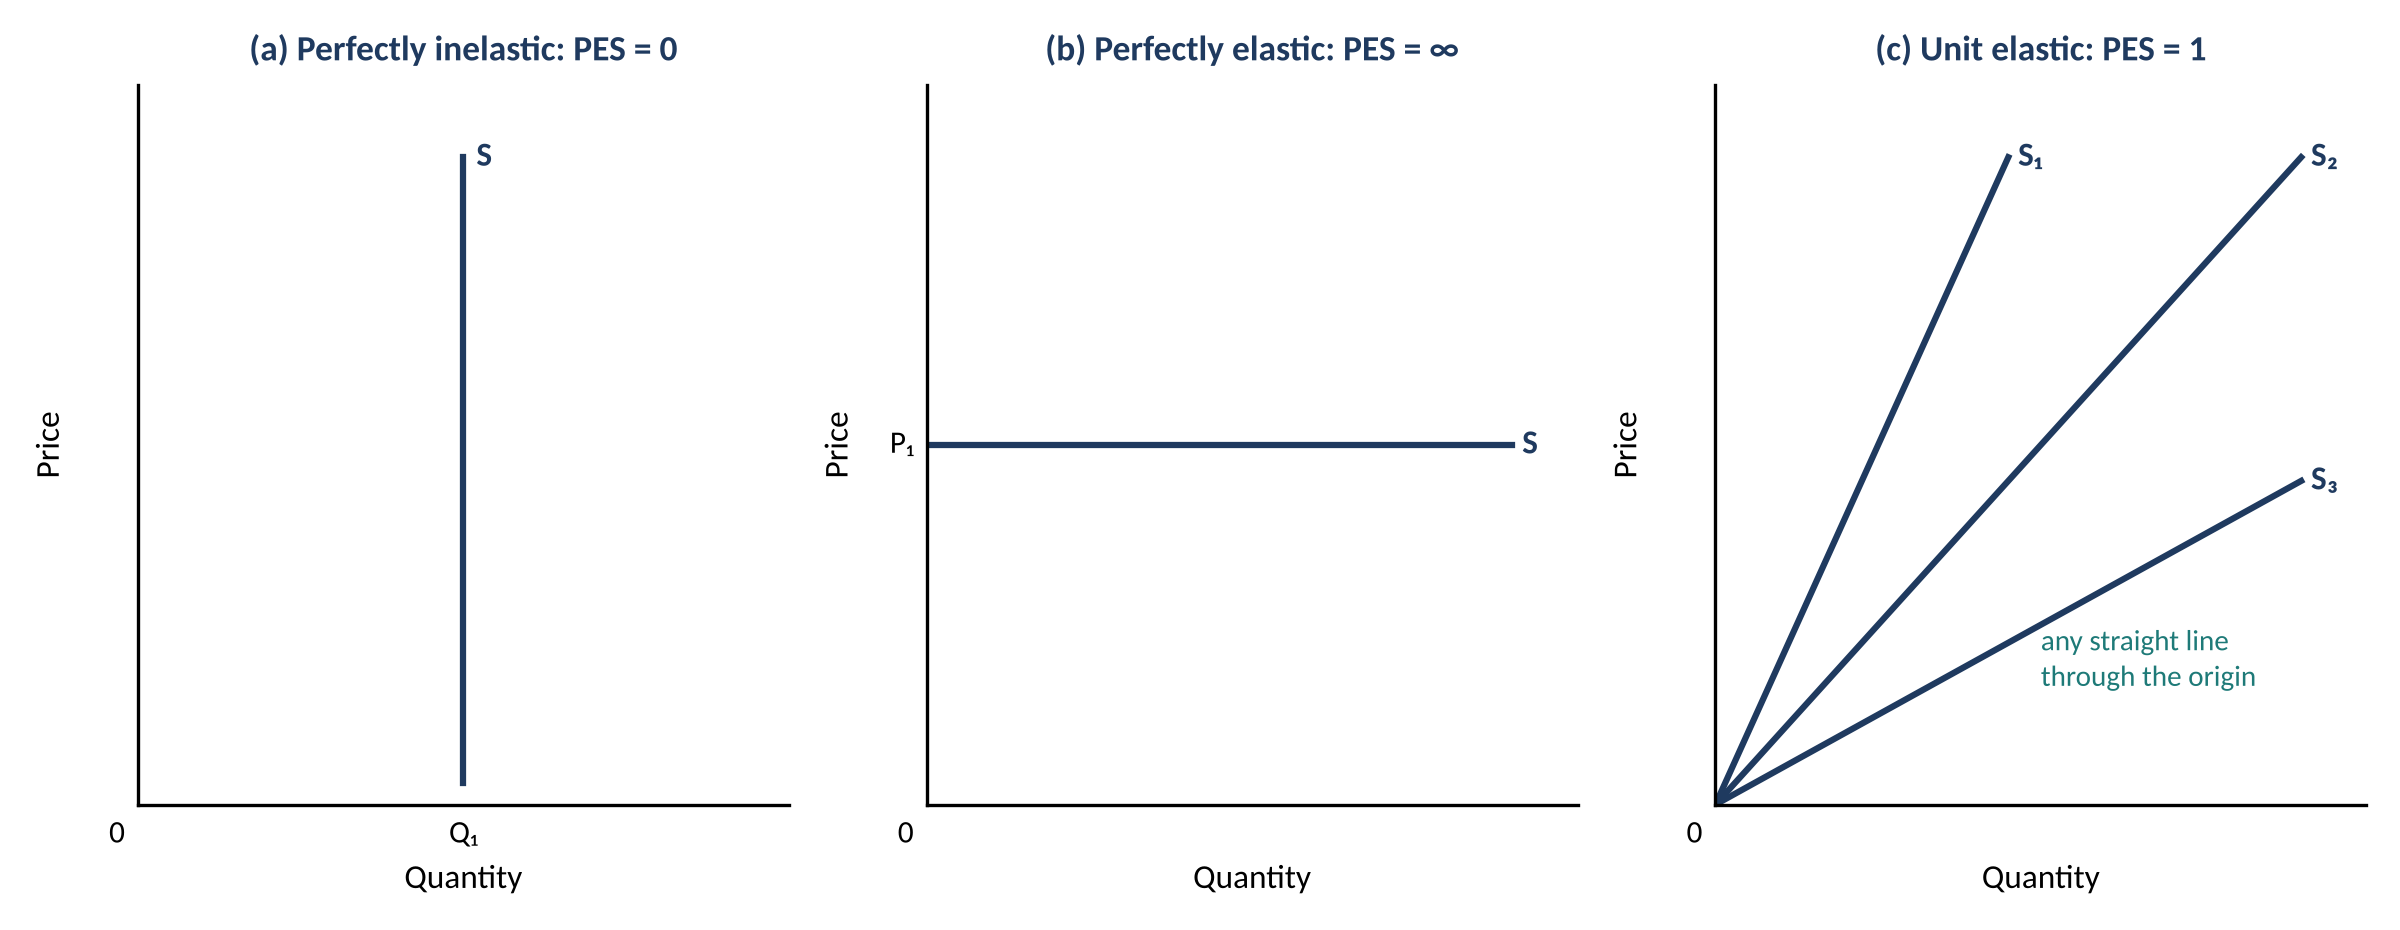
Any straight-line supply curve that starts at the origin has a PES of exactly 1, whatever its slope, because quantity and price always change by the same percentage along it.
Task: the price of cauliflower rises from ₹40 to ₹48 per kg. Over the next week, the quantity supplied to a city market rises from 50 to 53 tonnes. Calculate PES.
Step 1: % change in price = (48 − 40) ÷ 40 × 100 = +20%
Step 2: % change in quantity supplied = (53 − 50) ÷ 50 × 100 = +6%
Step 3: PES = 6 ÷ 20 = 0.3, so supply is price inelastic in the short run.
Comparison: a T-shirt factory that raises output by 25% when the price rises by 10% has PES = 25 ÷ 10 = 2.5 (price elastic).
- 2.6.2 Determinants of PES
- 2.6.3 Why PES for primary commodities is generally lower than for manufactured products (HL only)
- Exam practice: 5 questions with mark allocations
- 2 exemplar answers with full model answers and examiner commentary