Level: SL and HL
The AD/AS model explains why output, unemployment and the price level change. Economists disagree about the shape of aggregate supply, and that disagreement shapes their policy advice.
3.2.1 Aggregate demand (AD)
Definition
Aggregate demand (AD) is the total planned spending on an economy's goods and services at each average price level, in a given period.
Aggregate demand (AD) is the total planned spending on an economy's goods and services at each average price level, in a given period.
AD = C + I + G + (X − M): consumption + investment + government spending + net exports.
The AD curve slopes downwards: at a lower average price level, households' money holdings buy more (a wealth effect), interest rates tend to be lower so borrowing for spending rises (an interest rate effect), and domestic goods become more competitive against foreign goods (an international trade effect).
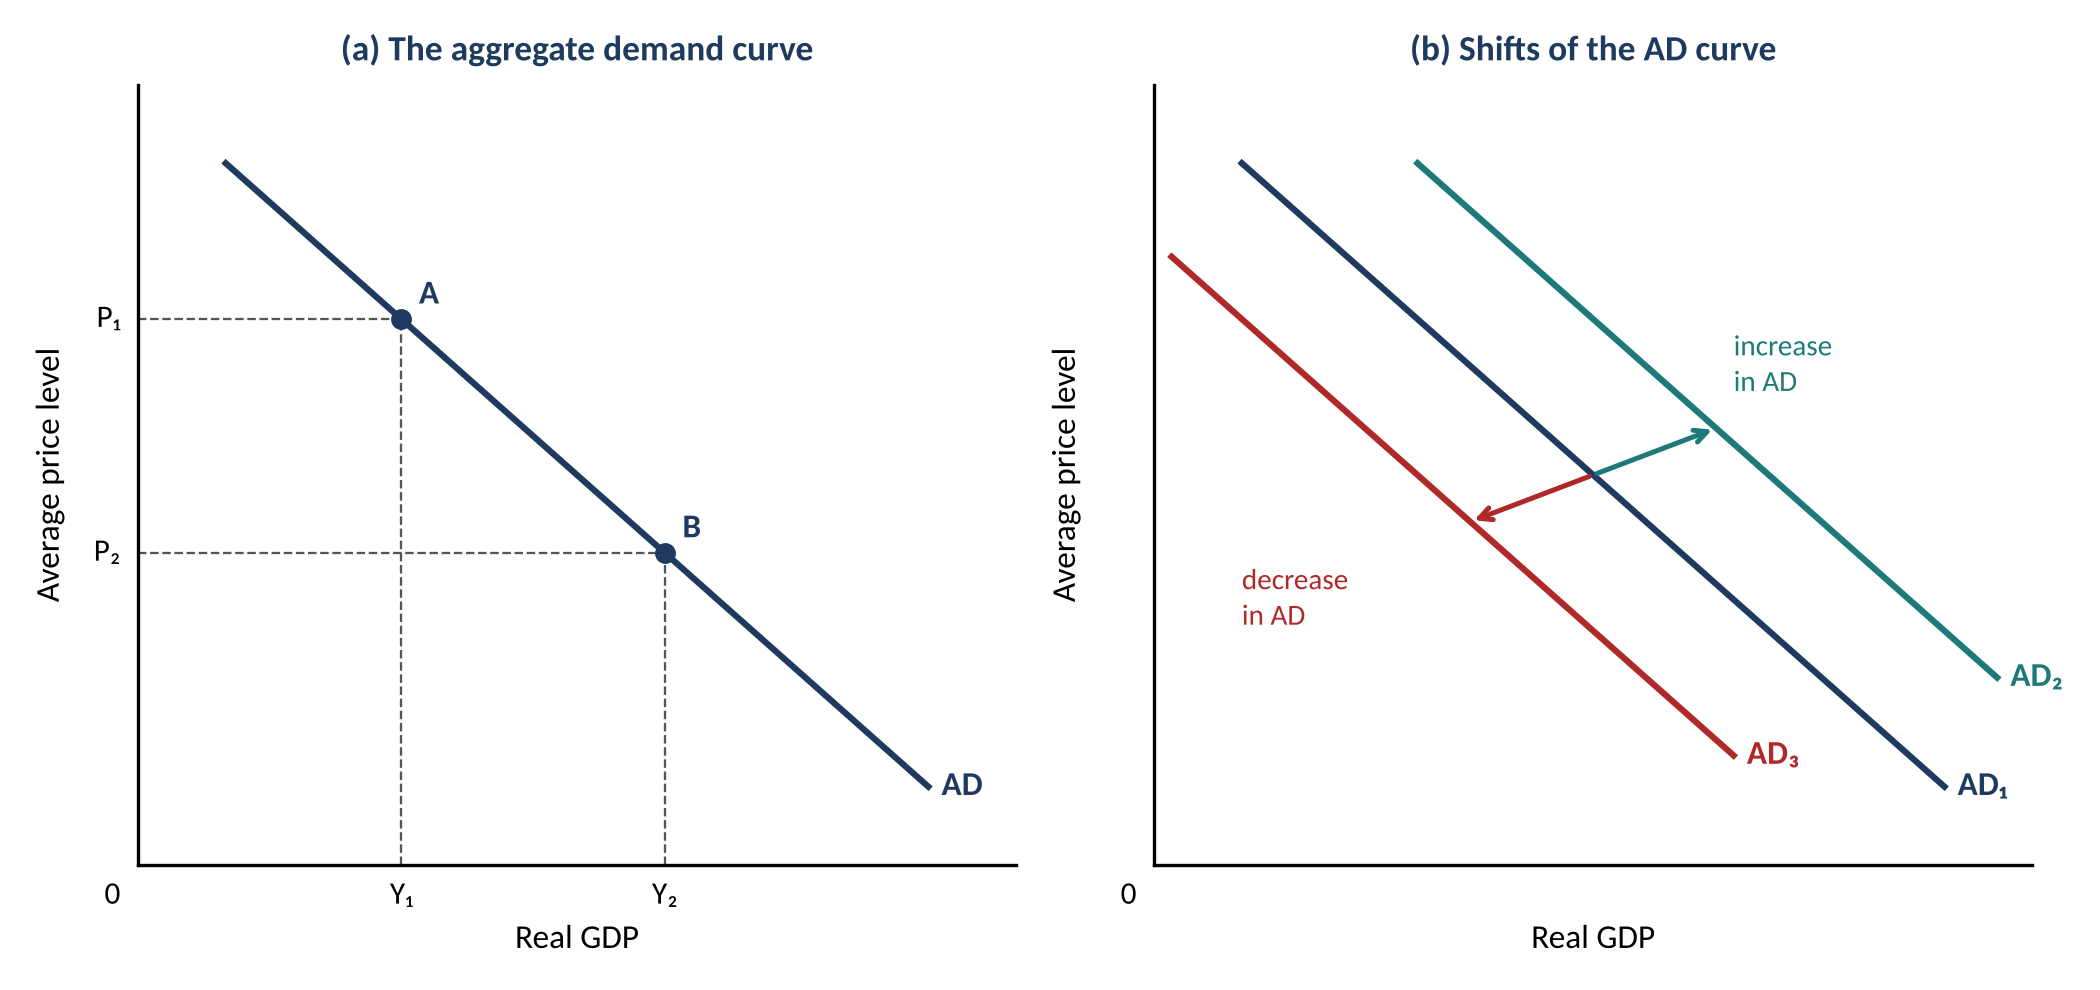
Figure 1: (a) the aggregate demand curve and (b) shifts of the AD curve
🔒 Also in the full notes
- 3.2.2 Determinants of the components of AD
- 3.2.3 Short-run aggregate supply (SRAS)
- 3.2.4 Alternative views of aggregate supply
- 3.2.5 Shifts of LRAS and Keynesian AS
- 3.2.6 Macroeconomic equilibrium
- 3.2.7 Assumptions and implications of the two models
- Exam practice: 5 questions with mark allocations
- 3 exemplar answers with full model answers and examiner commentary