Level: SL and HL
Economics studies how societies use scarce resources to meet unlimited wants, and how the choices they make affect people's well-being now and in the future.
Economics is a social science. It studies human behaviour: how individuals, firms and governments make choices when they cannot have everything they want. Because those choices depend on values, culture, institutions and incomes, economic outcomes cannot be predicted with the certainty of a laboratory experiment. Two people facing the same price rise may react quite differently.
Economics is also social in a second sense: decisions are interdependent. A farmer's choice of crop, a bank's lending decision and a government's tax policy all affect one another.
Microeconomics is the study of individual decision-makers (consumers, workers and firms) and of how individual markets work.
Macroeconomics is the study of the economy as a whole: total output, the general price level, unemployment, economic growth and the balance of trade.
| Branch | Focus | A typical question |
|---|---|---|
| Microeconomics | Individual markets, consumers and firms; prices of particular goods | Why do onion prices in India rise sharply after a weak monsoon? |
| Macroeconomics | The whole economy: growth, inflation, unemployment, trade | Why does the Reserve Bank of India (RBI) raise interest rates when inflation rises above its target? |
The course is built around nine concepts. They are lenses for analysing any issue and are especially useful when evaluating.
| Concept | What it means in this course |
|---|---|
| Scarcity | Resources are limited compared with the needs and wants they could satisfy. |
| Choice | Scarcity forces decision-makers to choose between alternatives, and every choice has an opportunity cost. |
| Efficiency | Getting the most value from scarce resources: producing at lowest cost and producing what society values most. |
| Equity | Fairness in how income, wealth and opportunities are distributed. Equity is not the same as equality. |
| Economic well-being | The level of prosperity and quality of life people enjoy, including income, health, education and security. |
| Sustainability | Meeting present needs without reducing the ability of future generations to meet theirs. |
| Change | Economies are dynamic: tastes, technology, resources and policies keep shifting. |
| Interdependence | Households, firms, governments and countries depend on one another, so a decision in one place has effects elsewhere. |
| Intervention | Government action that changes market outcomes, for example through taxes, subsidies, regulation or direct provision. |
Interdependence: coffee. Brazil is the world's largest coffee producer. When frost and drought have damaged Brazilian harvests in recent years, world coffee prices have risen sharply. Café chains in Japan and the UK paid more for beans, and some raised menu prices; growers in Vietnam and Kenya earned more per kilogram. One weather event in one country changed prices, profits and choices on several continents.
Factors of production are the resources used to produce goods and services. Economists group them into four categories, each earning its own reward.
| Factor | What it includes | Reward | Example |
|---|---|---|---|
| Land | All natural resources: fields, forests, minerals, water, fish stocks | Rent | Iron ore mined in Odisha |
| Labour | Human effort, physical and mental. Its quality depends on human capital (skills, education, health) | Wages | Software engineers at Infosys |
| Capital | Man-made aids to production: machinery, factories, roads, software. Also called physical capital | Interest | Robots on Maruti Suzuki's assembly lines |
| Entrepreneurship | Organising the other factors, taking risks and innovating | Profit | The founders who built Zomato into a listed company |
Scarcity is the situation in which resources are limited relative to the unlimited needs and wants they could be used to satisfy.
Needs are things essential for survival, such as food, water, shelter and basic health care. Wants are things people desire beyond their needs. As incomes rise, wants keep expanding: a household that buys its first scooter soon wants a car, then a better car.
Scarcity is relative, not absolute. Even the richest economies face it. Singapore has very little land, so it has used land reclamation to enlarge its territory by roughly a quarter since independence. Japan's ageing population makes labour increasingly scarce, which is why Japanese firms invest heavily in automation.
Scarcity in a rich and a developing economy. Singapore's government must decide whether each new piece of reclaimed land is used for housing, industry, a port or green space. In India, a state government with a fixed budget must decide whether to spend on new hospitals, rural roads or teacher salaries. The constraint differs in scale, but the problem is the same: limited resources, competing uses.
If resources are used faster than they can be replaced, scarcity becomes worse for future generations. Non-renewable resources (oil, coal, minerals) are used up permanently. Renewable resources (forests, fish stocks, groundwater) can regenerate, but only if they are not overused.
Sustainability means meeting the needs of the present without reducing the ability of future generations to meet their own needs.
Unlimited wants → pressure to raise output now → resources such as groundwater, fish stocks and fossil fuels are used faster than they regenerate → fewer resources are left for the future → scarcity becomes more severe over time.
Example: heavy pumping of groundwater for rice and wheat in Punjab has lowered the water table in many districts, raising pumping costs and threatening future harvests.
Opportunity cost is the value of the next best alternative given up when a choice is made.
Because resources are scarce, choosing one option means giving up others. Opportunity cost measures only the single next best alternative, not every possible alternative.
- A student who spends Saturday revising gives up the wages from a part-time job (if that was the next best use of the time).
- A firm such as Tata Steel that spends funds on a lower-emission steel plant gives up the chance to use the same funds to expand conventional capacity.
- A government that allocates more of its Union Budget to defence has less to spend on health or education, unless it borrows or raises taxes.
A free good is a good with no opportunity cost: it is so plentiful that using it does not take any away from anyone else, so its price is zero. An economic good is scarce, so producing or using it has an opportunity cost.
Classic examples are air in an unpolluted area, sunlight and seawater. But whether a good is free depends on time and place. Clean air in a heavily polluted city is scarce: households in Delhi buy air purifiers, and the city spends resources on pollution controls.
Is anything truly free? It depends on:
- Location: clean air in rural Himachal Pradesh may be free; in a polluted megacity it is not.
- Time: water may be plentiful in the monsoon and scarce in a summer drought.
- Who pays: a service that is free at the point of use, such as treatment by the UK's National Health Service, is not a free good. Doctors, nurses and medicines all have an opportunity cost, paid for through taxation.
Scarcity forces every society to answer three questions about how its resources are used.
| Question | What it asks | Example |
|---|---|---|
| What and how much to produce? | Which goods and services, and in what quantities? | More electric vehicles or more petrol cars? |
| How to produce? | Which combination of resources and technology? | Harvest wheat with combine harvesters (capital-intensive) or with farm workers (labour- intensive)? |
| For whom to produce? | How is output distributed among people? | Who gets access to private hospitals: only those who can pay, or everyone? |
The three questions can be answered by the market (the free interaction of buyers and sellers through the price mechanism), by government (planning and intervention), or by a combination of both.
A free market economy is one in which resources are privately owned and the price mechanism allocates them, with minimal government involvement.
A planned economy (command economy) is one in which the government owns most resources and decides what, how and for whom to produce.
A mixed economy combines private markets with significant government involvement.
| System | Who decides? | Main strengths | Main weaknesses | Closest examples |
|---|---|---|---|---|
| Free market | Consumers and firms, through prices | Efficiency; incentives to innovate; consumer choice | Inequality; under- provision of public goods; pollution | USA and Hong Kong lean strongly towards markets |
| Planned | The state | Can direct resources to priorities; can reduce inequality | Weak incentives; shortages and waste; little choice | North Korea, Cuba; the former Soviet Union |
| Mixed | Both | Combines market efficiency with government correction of failures | Getting the balance right is difficult; risk of government failure | India, UK, Germany, Brazil, Kenya |
India's shift along the spectrum. From the 1950s to 1991, India's economy relied heavily on Five- Year Plans, state-owned industry and a complex licensing system for private firms. After the 1991 balance of payments crisis, the government cut licensing, reduced tariffs and welcomed foreign investment. India is still a mixed economy, but markets now answer far more of the 'what' and 'how' questions than before.
Whether markets or government should answer the economic questions depends on:
- The type of good: markets provide most consumer goods well but under-provide public goods (such as street lighting) and merit goods (such as education).
- Society's priorities: markets reward efficiency; governments may give more weight to equity.
- The quality of government: intervention helps only if officials have good information and are not influenced by corruption or political pressure.
- Time: planning can mobilise resources quickly in an emergency, but markets usually adapt better over the long run.
In practice, every real economy is mixed. The real debate is about the balance.
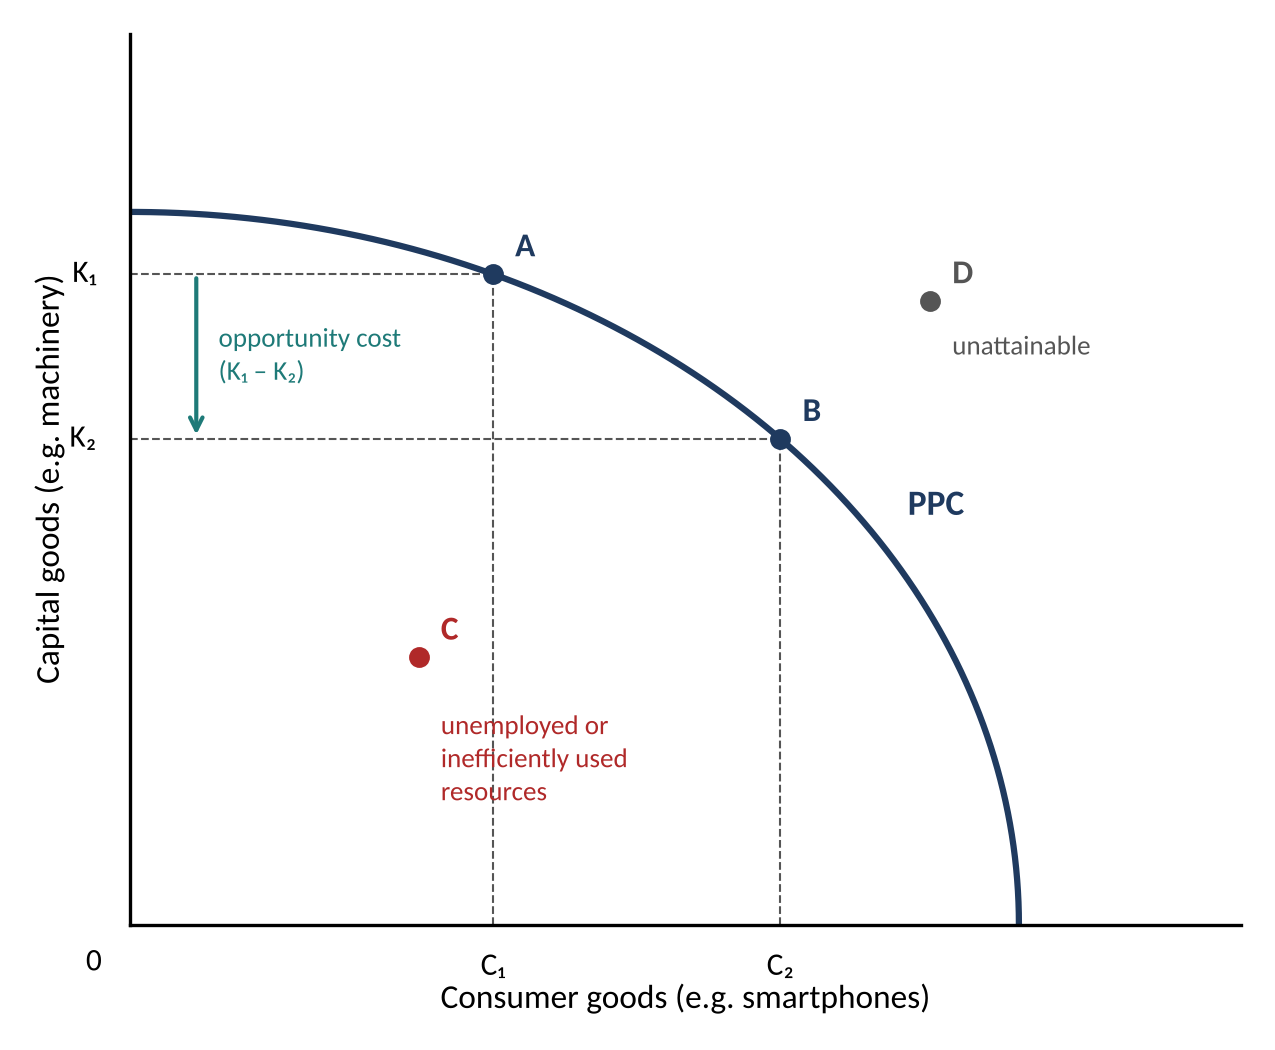
A production possibilities curve (PPC) shows the maximum combinations of two goods that an economy can produce in a given time period when all its resources are fully and efficiently employed, given the state of technology.
Assumptions of the model
- Only two goods (or two categories of goods) are produced.
- The quantity and quality of resources are fixed.
- Technology is fixed.
- Points on the curve assume all resources are fully employed and used efficiently.
- The analysis covers a fixed time period.
Features of the model
| Feature | How the PPC shows it |
|---|---|
| Scarcity | Point D lies outside the curve: the economy does not have the resources to produce it. |
| Choice | The economy must choose a point on (or inside) the curve, such as A or B. |
| Opportunity cost | Moving from A to B gains C₁C₂ consumer goods but gives up K₁K₂ capital goods. |
| Unemployment of resources | Point C, inside the curve, means some resources are idle or used inefficiently. |
| Efficiency | All points on the curve are productively efficient: more of one good is impossible without less of the other. |
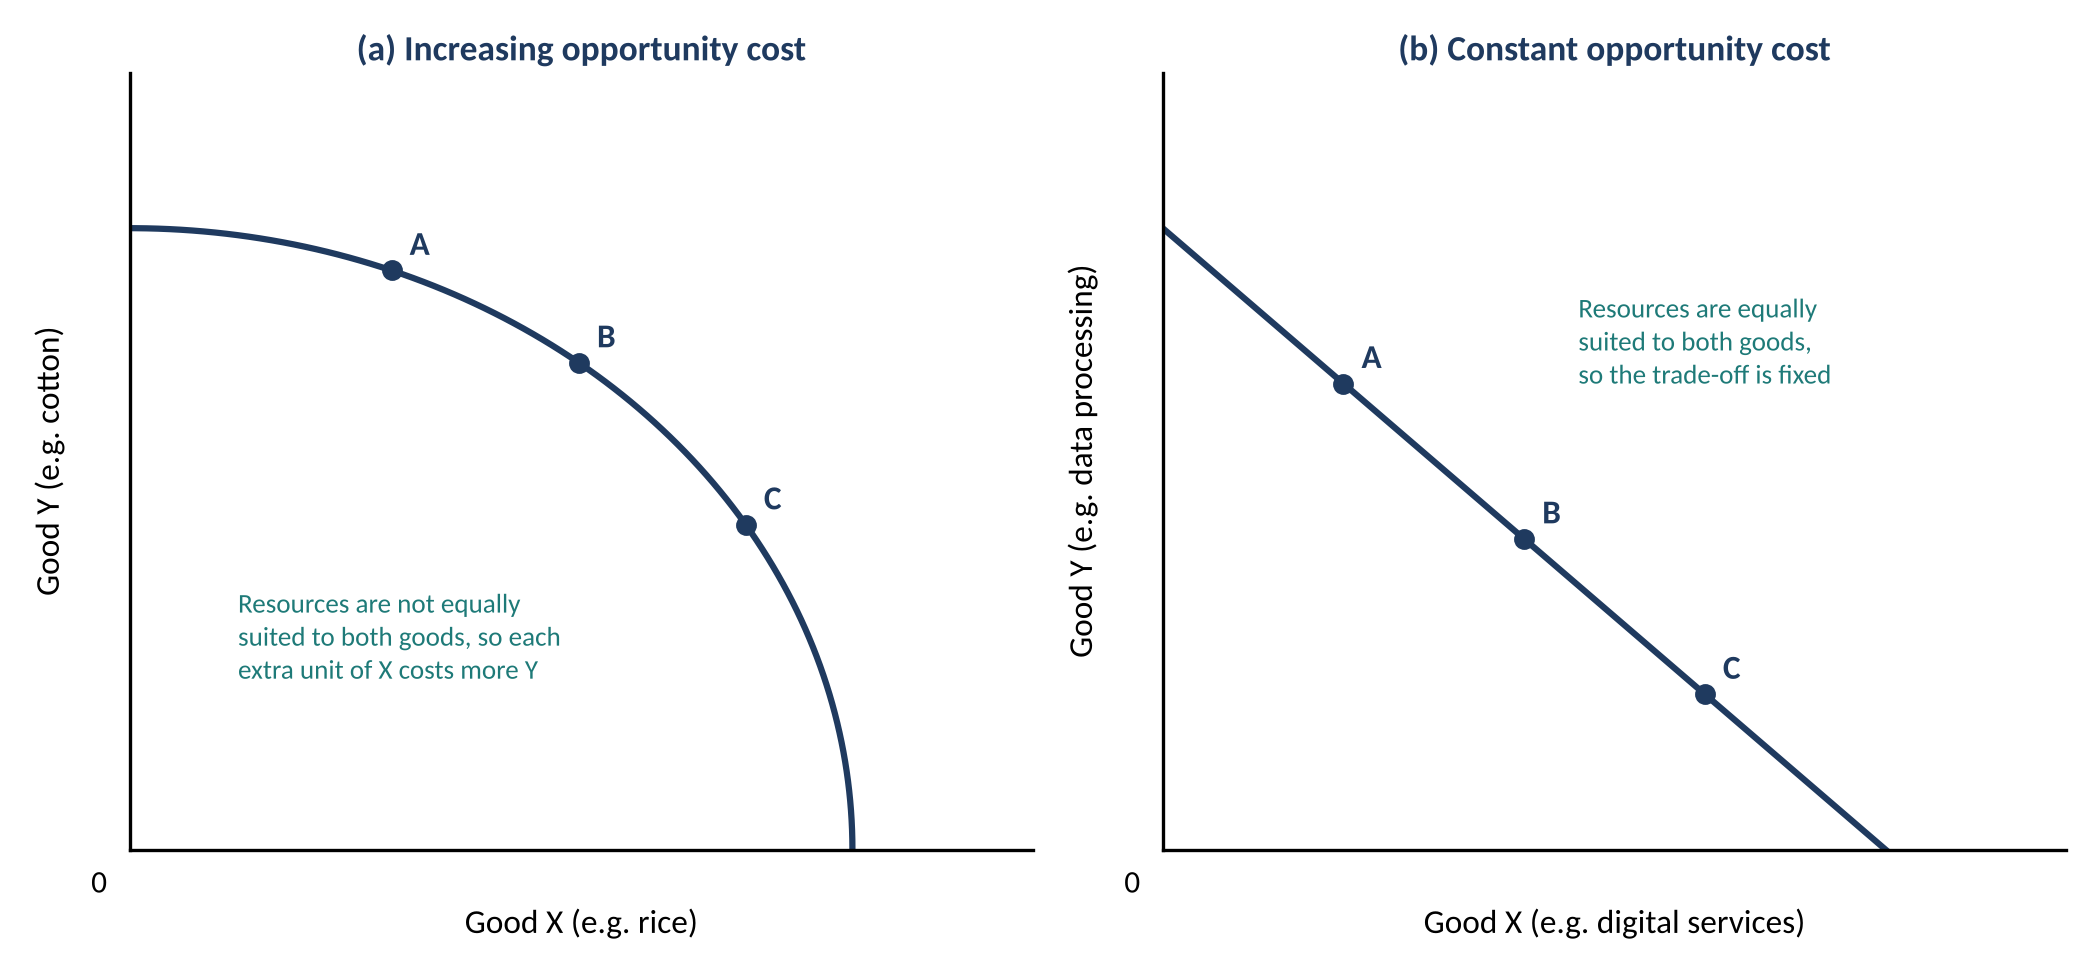
A PPC that bows outwards (concave to the origin) shows increasing opportunity cost. Resources are not equally suited to producing both goods, so as the economy produces more of one good it must transfer resources that are less and less suited to it, and gives up ever larger amounts of the other good.
A straight-line PPC shows constant opportunity cost: resources are equally suited to both goods, so each extra unit of one good always costs the same amount of the other.
An economy produces rice and cotton. The table shows five points on its PPC.
| Point | Rice (million tonnes) | Cotton (million bales) |
|---|---|---|
| A | 0 | 50 |
| B | 10 | 47 |
| C | 20 | 40 |
| D | 30 | 28 |
| E | 40 | 0 |
Task: find the opportunity cost of one tonne of rice for each move along the PPC.
Step 1: For each move, find the extra rice gained and the cotton given up.
Step 2: Divide the cotton given up by the extra rice gained.
A → B: 3 million bales ÷ 10 million tonnes = 0.3 bales per tonne of rice
B → C: 7 million bales ÷ 10 million tonnes = 0.7 bales per tonne of rice
C → D: 12 million bales ÷ 10 million tonnes = 1.2 bales per tonne of rice
D → E: 28 million bales ÷ 10 million tonnes = 2.8 bales per tonne of rice
Conclusion: the opportunity cost of rice rises with each move, so this economy faces increasing opportunity cost and its PPC is concave to the origin.
Actual growth is an increase in the real output an economy produces (an increase in real GDP).
Growth in production possibilities (potential growth) is an increase in the maximum output an economy is able to produce, shown by an outward shift of the PPC.
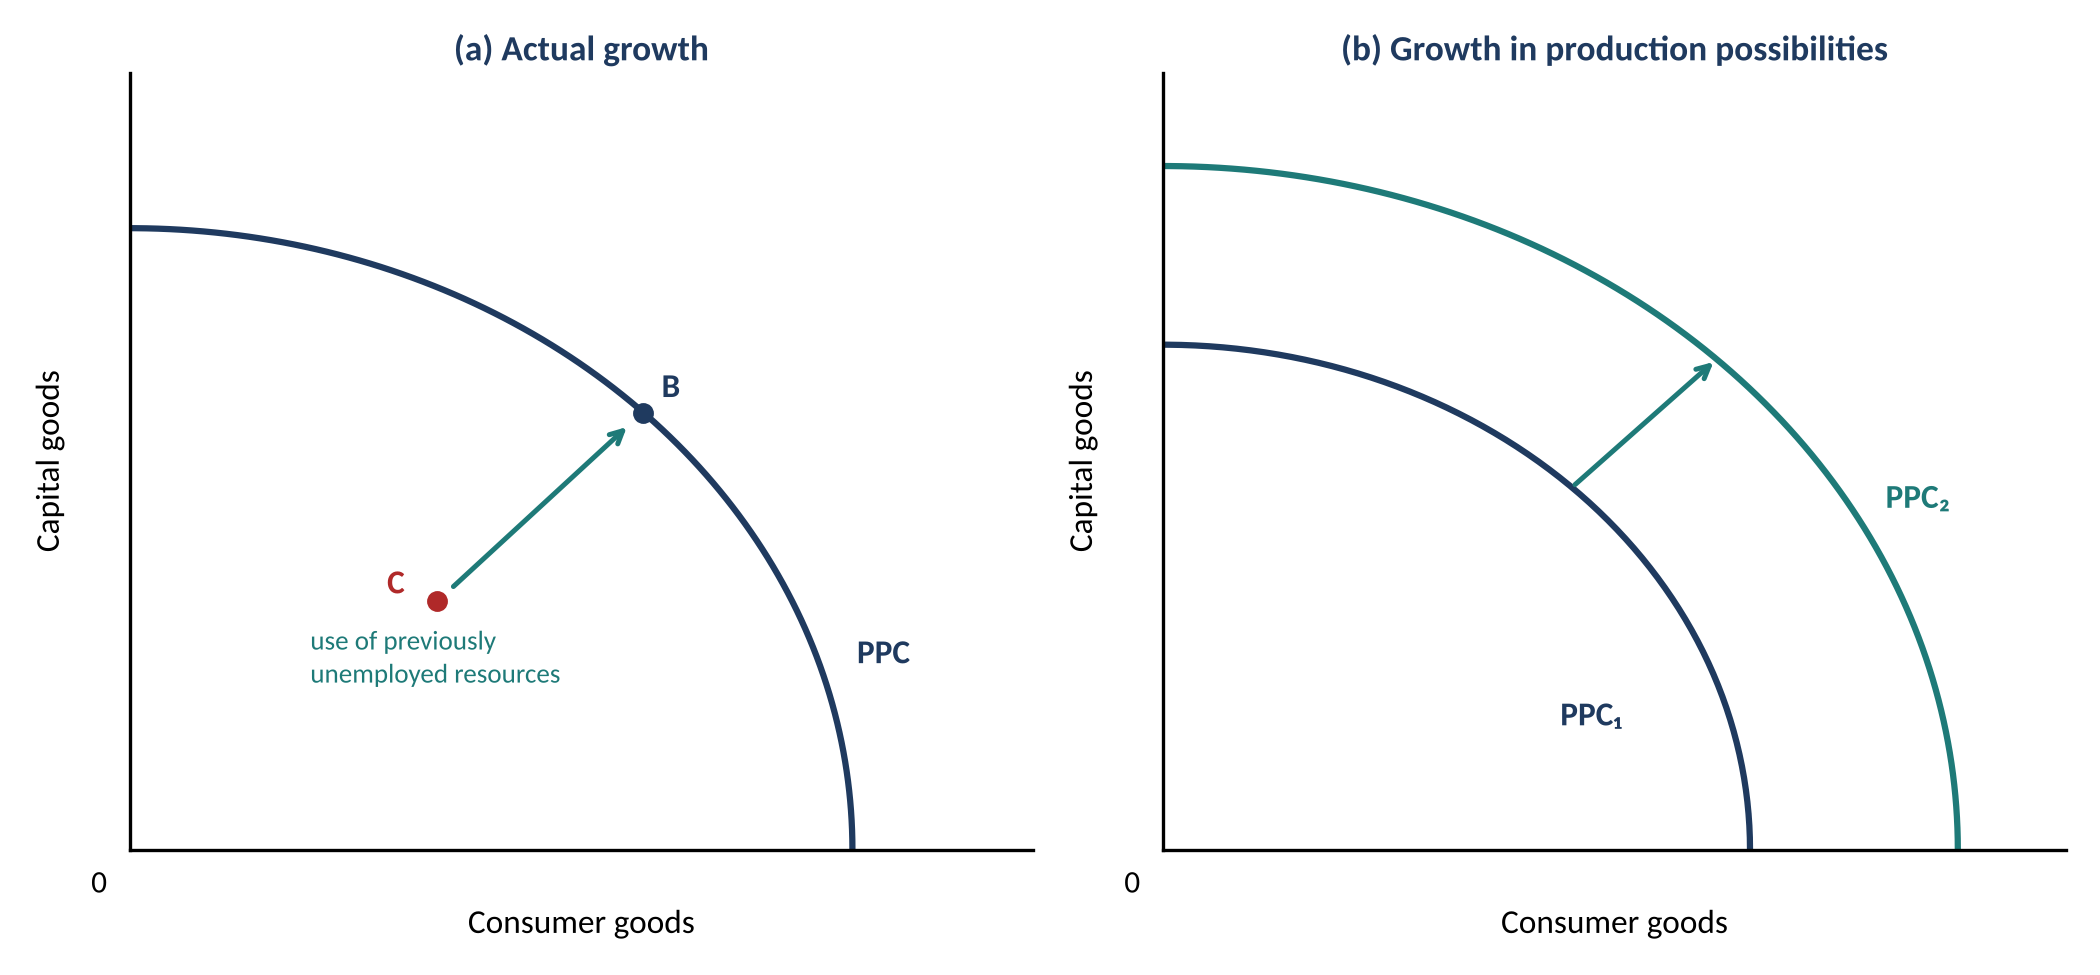
Actual growth can come from using previously unemployed resources (a move from C towards B) or from producing on a PPC that has shifted outwards. The PPC itself shifts outwards when:
- the quantity of resources rises, for example a growing labour force or the discovery of new natural resources;
- the quality of resources improves, for example through better education and health care (more human capital);
- technology improves, allowing more output from the same inputs.
The PPC can shift inwards after natural disasters, war, or large-scale emigration of workers, all of which destroy or remove resources.
Outward shifts. Guyana's offshore oil discoveries since 2015 have greatly increased its natural resources, and its output has grown faster than almost any other economy's. India's large working-age population is a potential source of outward shifts, but only if young workers gain the skills and jobs to use it.
Inward shift. The war that began in 2022 destroyed factories, farmland and infrastructure in Ukraine and caused millions of workers to leave, shifting its PPC inwards.
More capital goods today → fewer consumer goods now (the opportunity cost) → a larger stock of machinery and infrastructure → the PPC shifts outwards → more of both goods can be produced in future.
The circular flow of income model shows how money (income and spending) and real resources (factors, goods and services) flow between the decision-makers in an economy.
In the simplest version there are two sectors. Households own the factors of production and supply them to firms. Firms pay incomes (wages, rent, interest and profit) to households, which spend those incomes on the goods and services firms produce. Money flows one way; real resources and goods flow the other.
A fuller model adds three more decision-makers: the financial sector (banks), the government and the foreign sector (foreign firms and households). These create leakages (withdrawals) from the flow and injections into it.
A leakage is income that leaves the circular flow instead of being spent on domestic output.
An injection is spending that enters the circular flow from outside the household–firm loop.
| Sector | Leakage (out of the flow) | Injection (into the flow) |
|---|---|---|
| Financial sector | Savings (S) | Investment (I) |
| Government | Taxes (T) | Government spending (G) |
| Foreign sector | Imports (M) | Exports (X) |
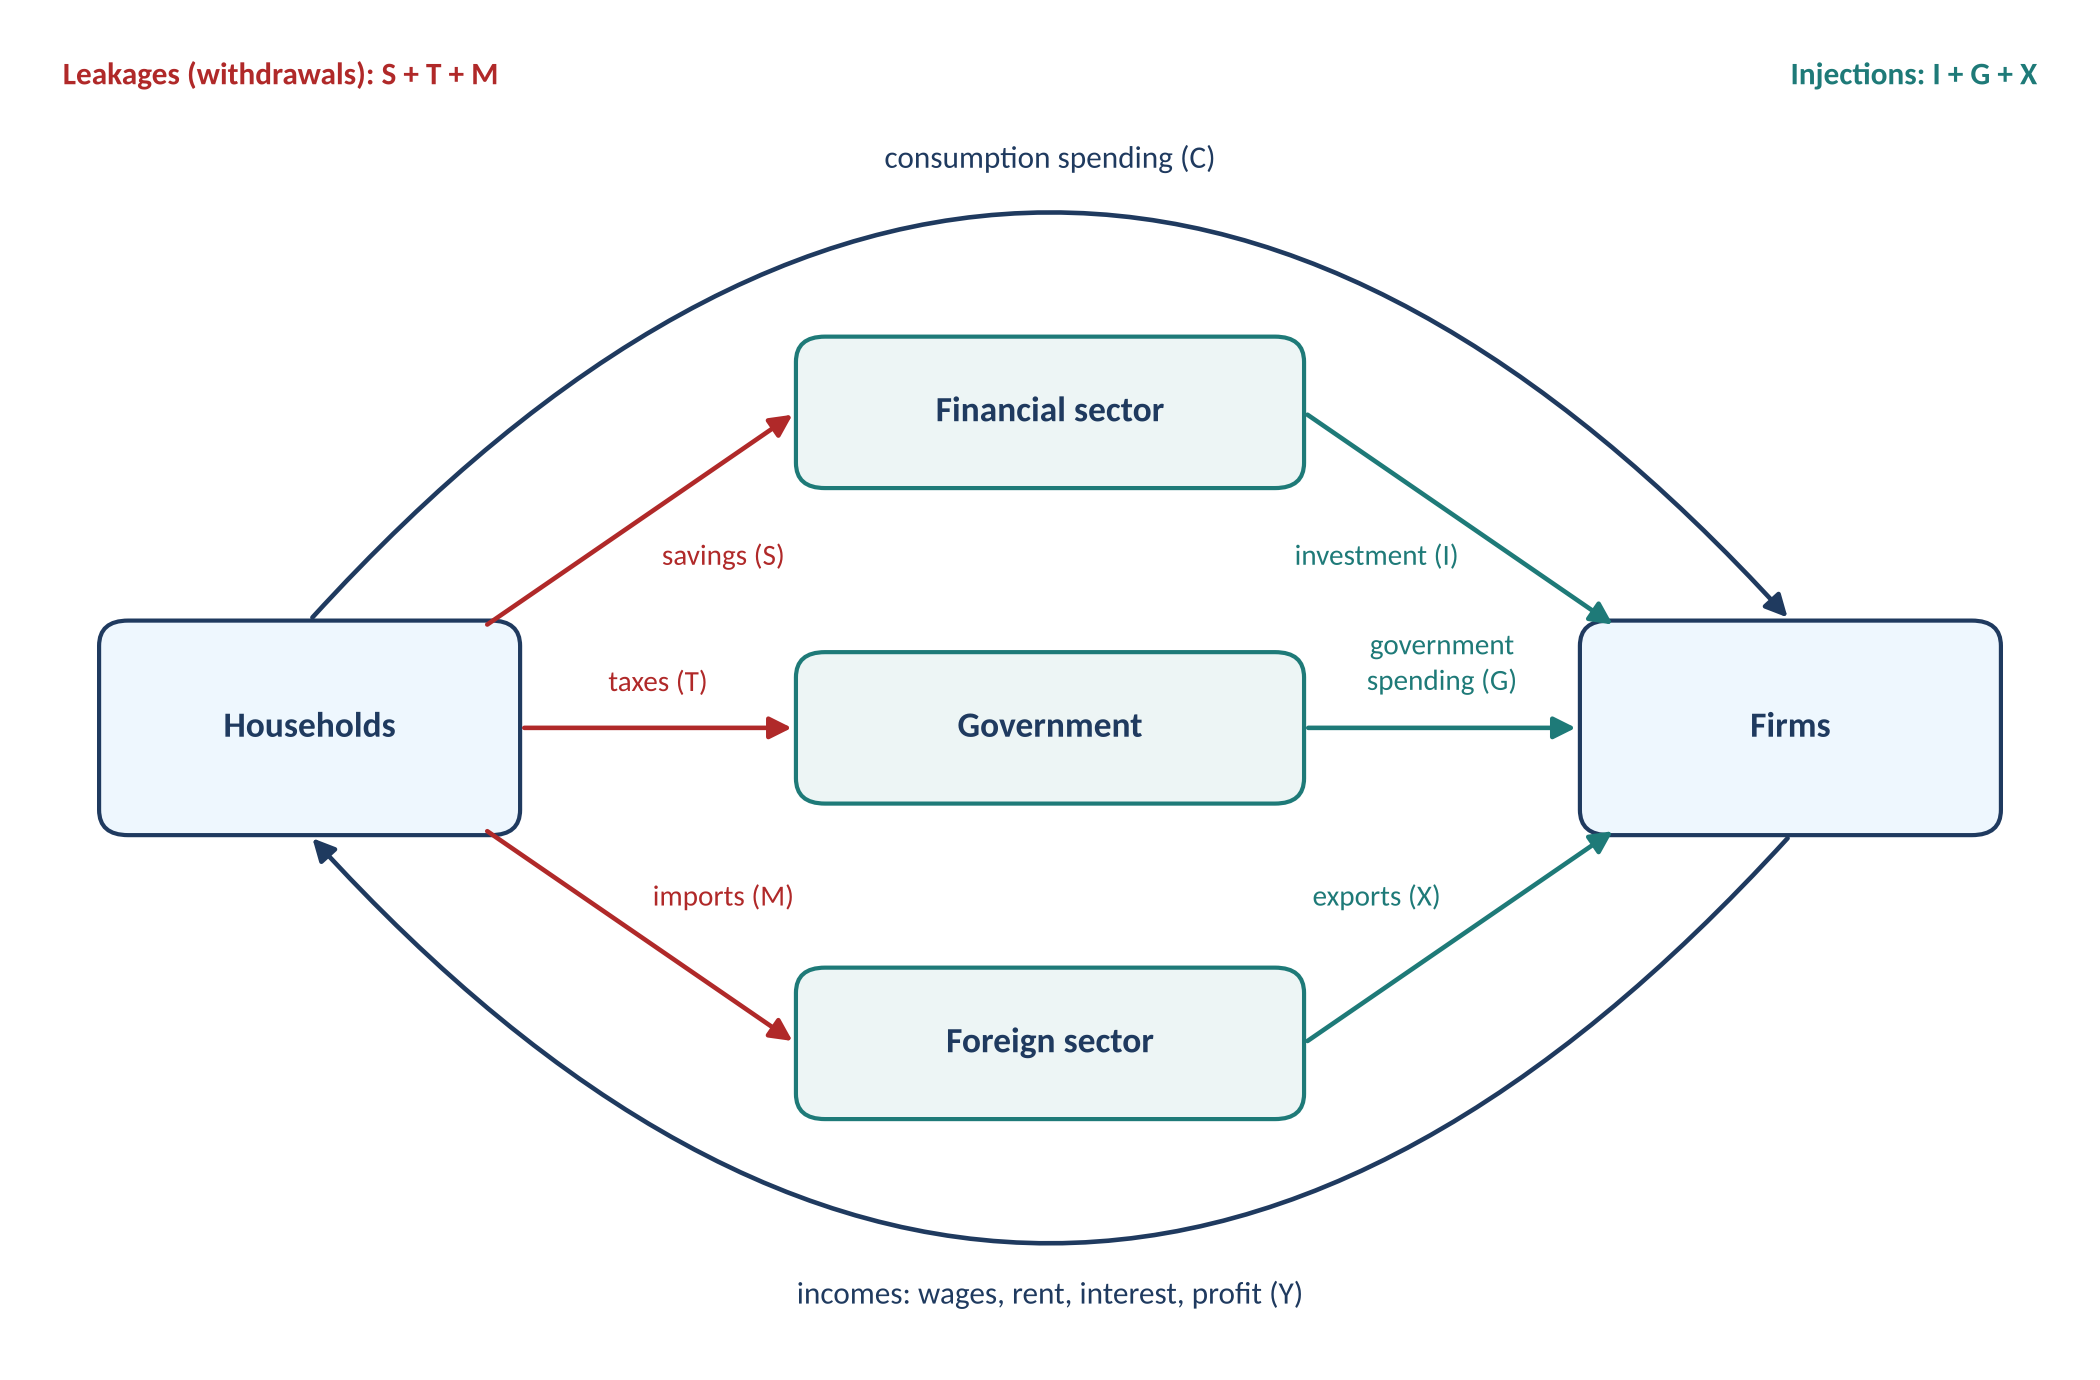
If injections are greater than leakages, the flow of income grows and national income rises. If leakages are greater than injections, national income falls. National income is in equilibrium when S + T + M = I + G + X.
A large leakage and a large injection. India imports most of the crude oil it uses, so a rise in world oil prices increases spending on imports, a leakage. Germany, by contrast, sells large volumes of cars and machinery abroad, so exports are a major injection into its circular flow.
Rise in demand for Indian IT services from US firms → exports (an injection) rise → Indian firms' revenues rise → firms hire more workers and pay higher incomes → households spend more → national income rises.
The circular flow model is useful for showing interdependence and why national income changes, but it simplifies reality. It does not show how quickly incomes change, how prices respond, or how income is distributed between rich and poor households.
Question: Define the term free good. [2]
Question: Using the rice and cotton data in the worked calculation, calculate the opportunity cost of increasing rice output from 30 to 40 million tonnes. [2]
Question: Using a PPC diagram, distinguish between actual growth and growth in production possibilities. [4]
Question: Using a circular flow of income diagram, explain how a fall in household savings could affect national income. [4]
Question: Explain, using a production possibilities curve (PPC) diagram, the concepts of scarcity, choice and opportunity cost. [10]
Question: Using real-world examples, evaluate the view that a market economy is the most effective way to answer the basic economic questions. [15]
Question: Using a PPC diagram, distinguish between actual growth and growth in production possibilities. [4]
Actual growth is an increase in the real output an economy produces. Growth in production possibilities is an increase in the maximum output the economy could produce if all its resources were fully and efficiently employed.
In Figure 3(a), actual growth is shown by the move from point C, inside the PPC, to point B on it. Previously unemployed resources are put to work, so output of both goods rises while the PPC stays where it is. In Figure 3(b), growth in production possibilities is shown by the outward shift from PPC₁ to PPC₂, caused by an increase in the quantity or quality of resources, or by better technology.
The two can happen separately: an economy can gain new capacity (PPC shifts out) but leave it idle, so there is no actual growth.
- Gives a precise definition of each term (AO1).
- Uses a correctly labelled diagram for each type of growth and refers to specific points and curves in the text (AO4).
- Explains what causes each movement, not just what it looks like (AO2).
- The final sentence shows the concepts are distinct, which is exactly what 'distinguish' asks for.
Question: Explain, using a production possibilities curve (PPC) diagram, the concepts of scarcity, choice and opportunity cost. [10]
Scarcity is the situation in which resources are limited relative to unlimited needs and wants. Choice is the decision about how to allocate scarce resources between competing uses. Opportunity cost is the value of the next best alternative given up when a choice is made.
A PPC shows the maximum combinations of two goods an economy can produce with its fixed resources and technology, when all resources are fully and efficiently employed. Figure 1 shows a PPC for capital goods and consumer goods.
[Candidate draws Figure 1: axes labelled capital goods and consumer goods; concave PPC; points A and B on the curve, C inside, D outside; K₁, K₂, C₁, C₂ marked.]
Scarcity. Point D lies outside the PPC. However much society wants that combination, it lacks the resources to produce it; the curve is the boundary set by scarcity. For example, India cannot expand defence production, highway building and hospital capacity as quickly as it would like all at once, because skilled labour, steel and land are limited.
Choice. Because D is unattainable, society must choose a point on or inside the curve. Point A gives more capital goods, point B more consumer goods. Both are possible, but not at the same time, so a choice must be made, whether through markets, government or both.
Opportunity cost. Moving from A to B raises consumer goods output from C₁ to C₂ but reduces capital goods from K₁ to K₂. The lost output K₁K₂ is the opportunity cost of the extra consumer goods. Because the PPC is concave, this opportunity cost rises as more consumer goods are produced: resources well suited to capital goods, such as engineers and heavy machinery, are moved into uses they are less suited to.
Point C shows unemployed or inefficiently used resources. Moving from C towards the curve raises output of both goods with no opportunity cost, which shows that opportunity cost arises only when resources are fully employed.
In summary, the PPC shows the central economic problem: scarcity sets the boundary, the boundary forces choice, and every choice on the boundary carries an opportunity cost.
- All three key terms are defined accurately at the start (AO1).
- The diagram is fully labelled: axes, curve, all points, and the opportunity cost marked on the axis (AO4).
- The diagram is used, not just drawn: each concept is linked to specific points (AO2).
- A real-world example (India) applies the theory to an actual economy (AO2).
- Going further, on increasing opportunity cost and point C, shows the depth needed for the top markband.
- A short conclusion ties the three concepts together.
Question: Using real-world examples, evaluate the view that a market economy is the most effective way to answer the basic economic questions. [15]
A market economy is one in which resources are privately owned and allocated by the price mechanism, with minimal government involvement. Every economy must answer three basic questions: what and how much to produce, how to produce, and for whom.
How markets answer the questions. What is decided by consumer demand. When demand for a product rises, its price and profitability rise, attracting resources. As demand for food delivery grew in Indian cities, Zomato and Swiggy expanded and thousands of restaurants joined their platforms without any government plan. How is decided by competition: firms that fail to use low-cost methods lose customers, so firms such as Maruti Suzuki keep investing in automation. For whom is decided by willingness and ability to pay: goods go to those who can afford them.
Arguments for the market. First, markets are efficient. Prices carry information about scarcity to millions of buyers and sellers, something no planner can collect. Second, the profit motive rewards innovation. After Reliance Jio entered India's mobile market in 2016, fierce competition drove mobile data prices down dramatically and brought hundreds of millions of people online. Third, the evidence from planned economies is poor: the Soviet Union suffered chronic shortages, and North Korea remains one of the poorest economies in the world. India's own growth rate rose markedly after the 1991 reforms gave markets a bigger role.
Arguments against. Markets fail in several important cases. They under-provide public goods such as street lighting and national defence, because firms cannot charge those who benefit. They ignore negative externalities: firms and drivers in Delhi do not pay for the health damage their pollution causes. They also answer 'for whom' in a way many people consider unfair. The USA, which relies heavily on markets for health care, spends more per person on health than any other country, yet around 25 million people have no health insurance. Finally, unregulated markets can be unstable: the 2008 global financial crisis began in loosely regulated financial markets.
Evaluation. How effective the market is depends on several factors. It depends on the type of good: markets work well for smartphones and restaurant meals, badly for public goods and goods with large externalities. It depends on priorities: if society values efficiency most, markets perform well; if it values equity, the 'for whom' answer is weak. It also depends on the quality of government: intervention only improves outcomes if officials have good information and are not influenced by corruption, as shortages under price controls in Venezuela show. In the long run, competitive markets tend to raise living standards most, but short-run hardship can be severe without a safety net.
Conclusion. A market economy is the most effective way to answer the 'what' and 'how' questions for most private goods. It is much less effective at answering 'for whom', and it fails for public goods and goods with externalities. This is why no country is a pure market economy. Economies such as Germany and Denmark rely on competitive markets but combine them with taxes, regulation and welfare spending. Overall, the most effective system is a mixed economy in which markets are the main mechanism and government corrects their failures.
- Key terms (market economy, the three basic questions) are defined at the start (AO1).
- Explains how the price mechanism answers each of the three questions, step by step (AO2).
- Several real-world examples, Indian and international, are used as evidence for arguments rather than as decoration (AO2, AO3).
- The answer is balanced, setting out the strengths and the weaknesses of markets (AO3).
- Evaluation uses 'it depends on' factors: type of good, society's priorities, quality of government, and short run versus long run (AO3).
- The conclusion answers the question directly, with a justified judgement (AO3).
- Defining opportunity cost as 'the cost of something' or as everything given up. Fix: it is the value of the next best alternative forgone: one alternative only.
- Calling a point inside the PPC 'inefficient' without saying why. Fix: say that resources are unemployed or not used productively, so output of both goods could rise with no opportunity cost.
- Shifting the PPC outwards to show recovery from a recession. Fix: putting unemployed resources back to work is a movement towards the curve; only more or better resources, or better technology, shift it.
- Leaving axes unlabelled, or labelling them 'goods' and 'services'. Fix: label each axis with a named good, and label the curve and every point you refer to.
- Calling air or sunlight a free good in every context. Fix: a good is free only if it has zero opportunity cost; clean air in a polluted city is an economic good.
- Treating free market and planned economies as pure types that exist in reality. Fix: all real economies are mixed; evaluate the balance, using real examples.
- Showing savings as an injection in the circular flow. Fix: savings, taxes and imports are leakages; investment, government spending and exports are injections.