It is a simple model that illustrates scarcity, choice, opportunity cost and efficiency. Assumptions: fixed quantity and quality of factors of production, fixed technology, full employment and productive efficiency, and only two goods.
| Point | Microwave ovens | Computers |
|---|---|---|
| A | 40 | 0 |
| B | 35 | 17 |
| C | 26 | 25 |
| D | 15 | 31 |
| E | 0 | 33 |
| F (inside the PPC) | 15 | 12 |
- Points on the curve (A to E): resources fully and efficiently used; more of one good means less of the other.
- Points inside the curve (F): unemployed or inefficiently used resources. Actual output is always inside or on the PPC.
- Points outside the curve (G): unattainable with current resources and technology.
- The curve is the boundary between what can and cannot be achieved. Potential output is output at full employment (unemployment at the natural rate).
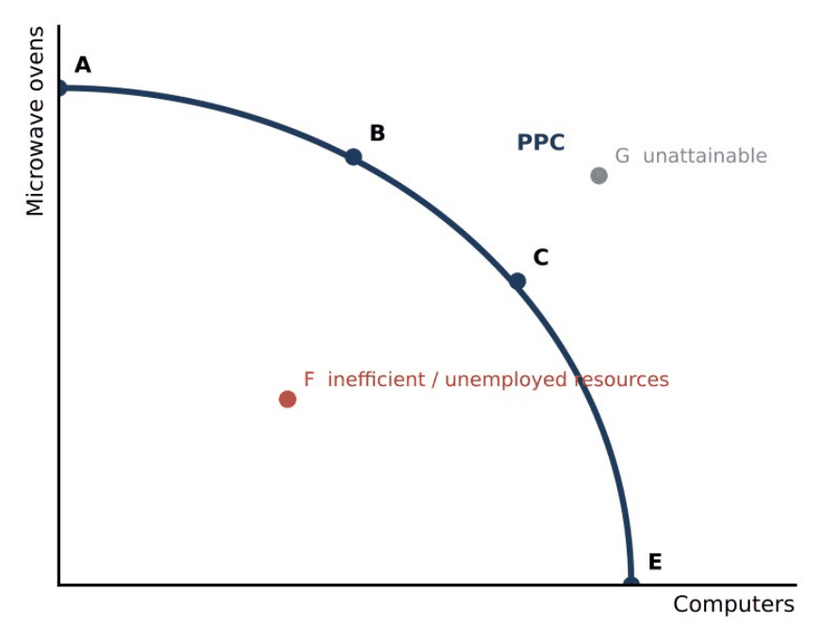
Analysis chain (AO2): Resources are scarce → the economy can only produce combinations on or inside the PPC → moving along the curve to produce more of one good means producing less of the other → the slope shows the opportunity cost.
- The PPC is a simplified model of two goods; real economies produce millions of goods.
- It shows what is possible, not what is desirable: the choice of point is a normative decision.
- Concave (bowed outward) PPC = increasing opportunity cost. Moving along the curve, each extra unit of one good requires giving up more and more of the other. This happens because factors of production are specialised, so they are not equally suitable for producing both goods.
- Straight-line PPC = constant opportunity cost. The economy gives up the same amount of one good for each extra unit of the other. This arises when factors are equally suited to making both goods, e.g. volleyballs and footballs (each extra football costs a fixed number of volleyballs).
Opportunity cost at any point = quantity of the good given up ÷ quantity of the other gained. Example: moving from B to C the economy gains 8 computers (25 – 17) and loses 9 microwave ovens (35 – 26), so each computer costs about 1.1 ovens.
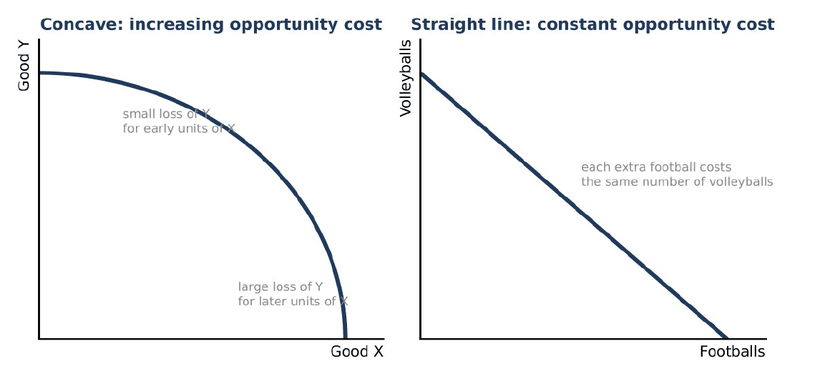
Analysis chain (AO2): Resources are not equally suited to all uses → as more of one good is produced, less suitable resources must be switched → more of the other good is given up for each extra unit → increasing opportunity cost → a concave PPC.
- A straight-line PPC (constant opportunity cost) only applies when resources are equally suited to both goods, which is rare in practice.
| Outward (right) shift: economic growth | Inward (left) shift | |
|---|---|---|
| Causes | Increase in quantity of resources (e.g. more labour, discovery of lithium); improvement in quality of resources (education, training, better machinery, more skilled workers); new and better technology | Fall in quantity or quality of resources: depletion of natural resources, war or natural disaster, migration of skilled workers, damaged capital |
| Consequences | Higher potential output; economy can produce more of both goods; higher living standards | Lower potential output; less of both goods; lower living standards |
A shift need not be parallel: technological progress that favours one good (e.g. computers) increases the maximum output of that good proportionately more, so the curve shifts out more on that axis. Increased unemployment moves the economy to a point inside the PPC, not a shift of the curve.
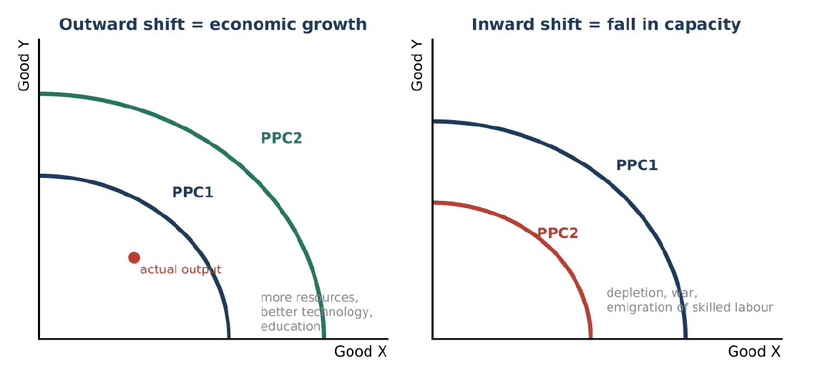
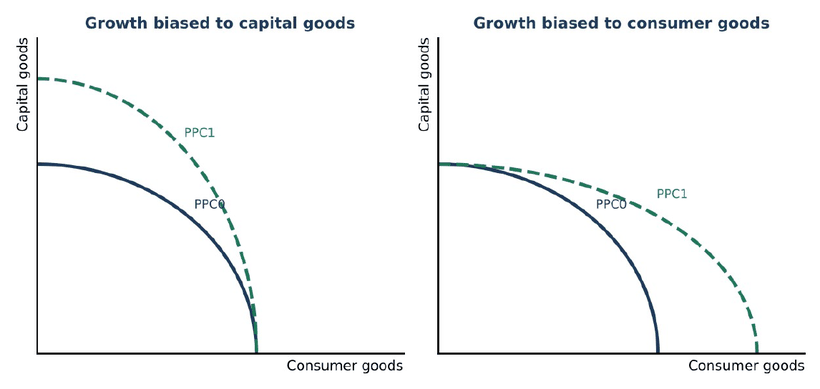
Analysis chain (AO2): More or better factors of production (investment, education, technology, immigration) → greater productive capacity → PPC shifts outward → higher potential output.
- An outward shift only shows potential growth; actual output rises only if the extra resources are used.
- Growth biased towards capital goods may lower current consumption but raise future living standards — a trade-off over time.
A point inside the PPC shows underemployment or inefficient use of resources. The economy can produce more of one or both goods without any opportunity cost by using resources fully, e.g. by reducing unemployment, until it reaches the curve. Once on the curve, producing more of one good means giving up the other. Movement from a point inside to the curve is an increase in actual output (a recovery), whereas an outward shift of the curve is an increase in potential output (economic growth).
Analysis chain (AO2): Unemployed or underused resources → economy produces inside the PPC → output can rise without any opportunity cost by using these resources → movement towards the curve.
- Not every point on the PPC is equally desirable; allocative efficiency depends on what consumers want.
- A point inside the PPC may reflect inefficiency (poor technology, bad management) rather than unemployment.
| No. | Question | Marks | Model answer |
|---|---|---|---|
| 1 | With the help of a PPC diagram, explain the meaning of labour productivity and how a change in it can alter an economy's production possibilities. | 8 | ✓ below |
| 2 | Using production possibility curves, explain how both microeconomic issues (such as opportunity cost) and macroeconomic issues (such as unemployment and growth) can be illustrated. | 8 | ✓ below |
| 3 | With the help of PPC diagram(s), distinguish between constant and increasing opportunity costs and consider how today's choice between capital and consumer goods affects future growth. | 8 | |
| 4 | With the help of a PPC diagram, explain what a point inside the curve shows and consider whether the economy will remain there for long. | 8 | |
| 5 | Assess whether an outward shift of the PPC can only be caused by an increase in the quantity of resources. | 12 |
Question: With the help of a PPC diagram, explain the meaning of labour productivity and how a change in it can alter an economy's production possibilities. [8]
[AO1 Knowledge & understanding] Labour productivity is the output produced per worker (or per worker-hour) in a given period. A production possibility curve (PPC) shows the maximum combinations of two goods an economy can produce when all its resources are fully and efficiently employed, given the state of technology.
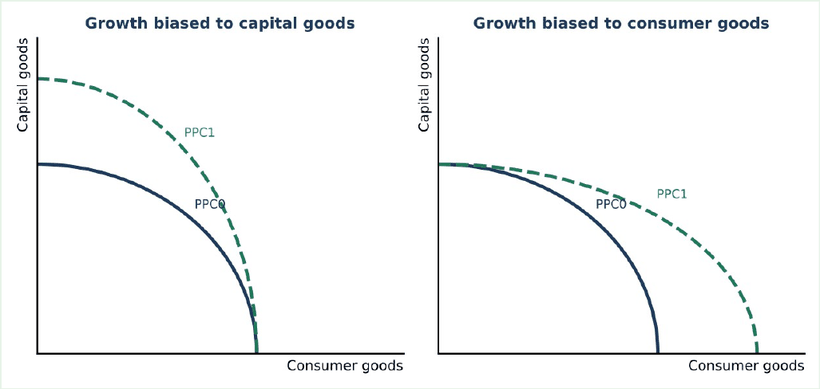
[AO2 Analysis] If labour productivity rises, for example because of better education, training or new technology, each worker can produce more output with the same hours of work. The economy's productive capacity increases, so the PPC shifts outwards: the economy can now produce more of both goods. If the productivity increase affects only one industry, the shift is biased: for example, if productivity rises only in the manufacture of capital goods (through automation in engineering), the PPC pivots outward mainly along the capital goods axis, while the maximum output of consumer goods is unchanged or changes less. A fall in labour productivity, for example due to a pandemic that harms workers' health, would shift the PPC inwards. Higher productivity also changes the opportunity cost of producing each good, which is shown by the changed slope of the curve.
[AO3 Evaluation] An outward shift shows only an increase in potential output; actual output rises only if the economy uses its resources fully. The effect also depends on whether the productivity gains are widespread or limited to one sector.
- AO1: both terms defined.
- AO2: diagram with shift; explains outward, biased and inward shifts and the effect on opportunity cost.
- AO3: potential vs actual output and the sector-specific nature of gains.
Question: Using production possibility curves, explain how both microeconomic issues (such as opportunity cost) and macroeconomic issues (such as unemployment and growth) can be illustrated. [8]
[AO1 Knowledge & understanding] A production possibility curve (PPC) shows the maximum combinations of two goods an economy can produce with full and efficient use of its resources. Microeconomic issues relate to individual markets and choices; macroeconomic issues relate to the economy as a whole, such as unemployment and growth.
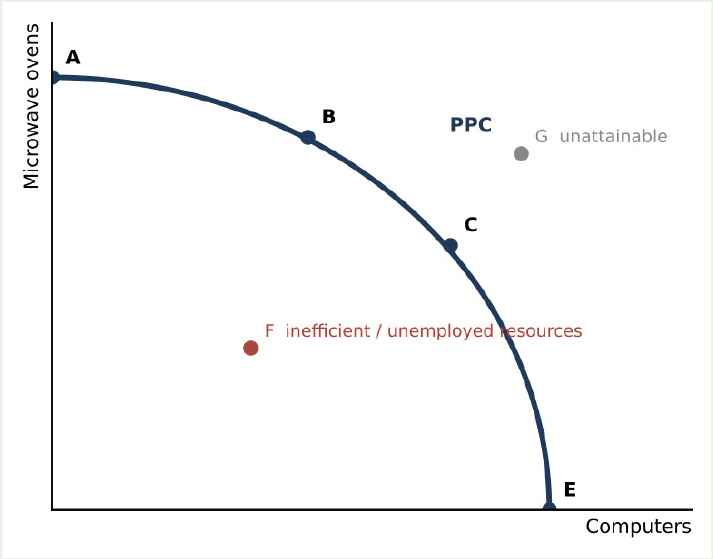
[AO2 Analysis] Microeconomic issues: the PPC shows scarcity, because points outside the curve are unattainable; choice, because society must choose a point on the curve; and opportunity cost, because moving along the curve to produce more of one good means producing less of the other. The concave shape shows increasing opportunity cost, because resources are not equally suited to producing both goods. The PPC can also show the effect of specialisation and of changes in resource allocation between industries. Macroeconomic issues: a point inside the curve shows unemployment or underused resources, as in a recession: output can rise without any opportunity cost by using these resources. Movement from inside the curve towards it shows actual economic growth. An outward shift of the curve shows potential economic growth, caused by more or better resources, such as investment in capital or education. An inward shift can show a loss of productive capacity, for example after a natural disaster or war.
[AO3 Evaluation] The PPC is a simplified model of only two goods and does not show the price level, so it cannot show inflation or the balance of payments. It is therefore useful for illustrating some macroeconomic issues, but AD/AS analysis is needed for others.
- AO1: PPC defined and micro/macro distinguished.
- AO2: micro issues (scarcity, choice, opportunity cost, increasing costs) and macro issues (unemployment, actual and potential growth, inward shifts) each linked to a feature of the diagram.
- AO3: limitation of the model.