Worked example: population growth
Birth rate = 19 per 1000; death rate = 7 per 1000; net migration = −0.4 per 1000. Natural increase = 19 − 7 = 12 per 1000 = 1.2%. Population growth = (12 − 0.4) ÷ 1000 = 1.16% a year. In a country of 100 million: population rises by 1.16 million in a year.
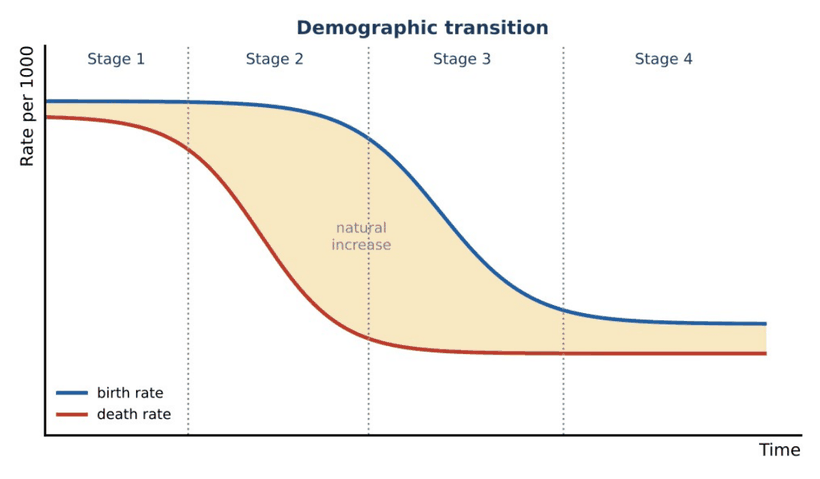
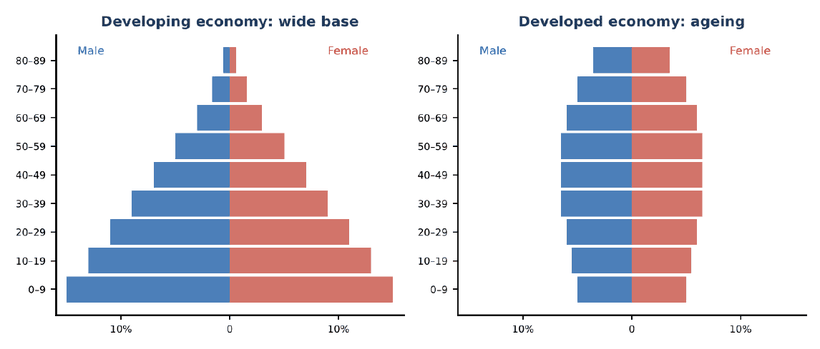
Developing countries typically have higher birth rates and infant mortality, a young population (wide-based pyramid) and a high dependency ratio of children; developed countries have low birth and death rates and an ageing population (high old-age dependency). India is in stage 3 of the demographic transition, with a large working-age population (demographic dividend) that can boost growth if jobs and skills are provided.
Urbanisation: the increase in the proportion of a population living in towns and cities. It is associated with industrialisation and higher productivity (agglomeration economies), better access to services and jobs, but also with congestion, pollution, slums and pressure on infrastructure (Mumbai, Dhaka, Lagos). Around 35–40% of Indians live in urban areas, rising steadily.
- 11.4.2 Income distribution
- 11.4.3 Employment structure and pattern of trade
- Exam practice: 4 practice questions
- 3 exemplar 20-mark essays with full model answers, mark breakdowns and common mistakes