Level: SL and HL
Raw accounts state what happened; ratios say whether it was any good — and what to do about it.
Guiding question
Profit is up — so why might a sharp analyst still be worried?
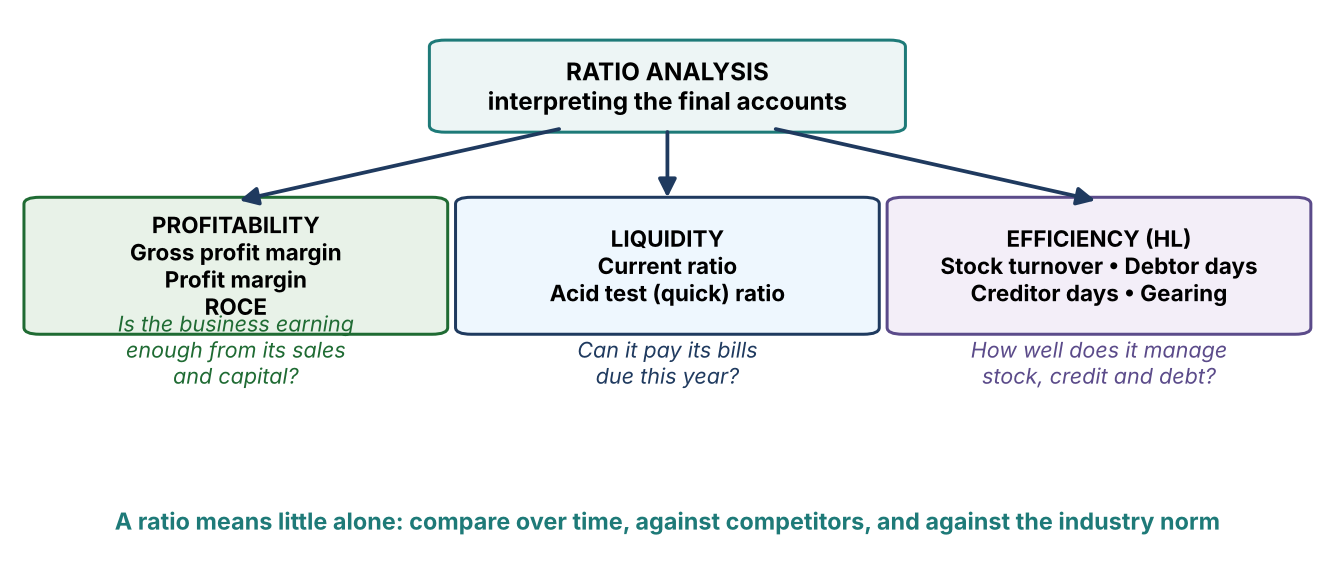
- I can calculate and interpret gross profit margin, profit margin and ROCE (AO4)
- I can calculate and interpret the current ratio and the acid test (quick) ratio (AO4)
- I can recommend strategies to improve profitability and liquidity ratios
Profit margin = profit before interest and tax ÷ sales revenue × 100 — the share left after all operating costs.
Return on capital employed (ROCE) = profit before interest and tax ÷ capital employed × 100, where capital employed = non-current liabilities + equity — the return earned on the long-term funds invested in the business.
Using Deodar Furniture's accounts from 3.4 (sales 900, gross profit 540, profit before interest and tax 190, equity 550, non-current liabilities 250 — ₹000):
GPM = 540 ÷ 900 × 100 = 60% → Profit margin = 190 ÷ 900 × 100 = 21.1% → Capital employed = 250 + 550 = 800; ROCE = 190 ÷ 800 × 100 = 23.75%
The 38.9-point gap between GPM and profit margin is the weight of expenses (overheads) — a diagnostic in itself.
Interpretation needs comparison: against the firm's own past (trend), against competitors, and against the return available elsewhere (ROCE below the bank's deposit rate would make the whole enterprise questionable). A high GPM with a thin profit margin points at bloated overheads; a healthy profit margin with weak ROCE points at too much capital for the profit generated.
| Lever | Typical actions | Risks and limits |
|---|---|---|
| Raise prices | Premium positioning, better branding | Lost sales if demand is price- sensitive; competitor response |
| Cut direct costs (GPM) | Cheaper suppliers, bulk buying, less waste, redesign | Quality and reliability may fall with cheap inputs |
| Cut overheads (profit margin) | Smaller premises, energy efficiency, delayering, marketing review | Capability loss; morale damage; false economies |
| Work capital harder (ROCE) | Sell underused assets, lease instead of own, lift sales from existing capacity | Selling assets sacrifices future capacity; leasing adds running costs |
- 3.5.2 Liquidity ratios and strategies to improve them
- Exam practice: 5 questions with mark allocations
- 2 exemplar answers with model answers and examiner-style commentary
- Where students commonly lose marks