Tactics are short-term actions taken to carry out a strategy (Topic 1.4.1).
Strategy answers three questions: Where are we now? Where do we want to be? How will we get there? Its purpose is to give the whole organisation a coordinated direction, to allocate scarce resources to the most important priorities, and to build a lasting competitive advantage — a reason customers choose this business over its rivals.
| Stage | Key question | Tools and activities |
|---|---|---|
| Strategic analysis | Where are we now, and what is happening around us? | SWOT, PEST, Porter's five forces, core competence framework, market research, financial ratio analysis |
| Strategic choice | Which direction should we take? | Ansoff matrix, blue ocean strategy, decision trees, scenario planning, investment appraisal |
| Strategic implementation | How do we make it happen? | Corporate planning, budgets, organisational structure, leadership, culture, force field analysis, managing change |
The stages form a cycle: after implementation, results are reviewed against objectives and the analysis begins again.
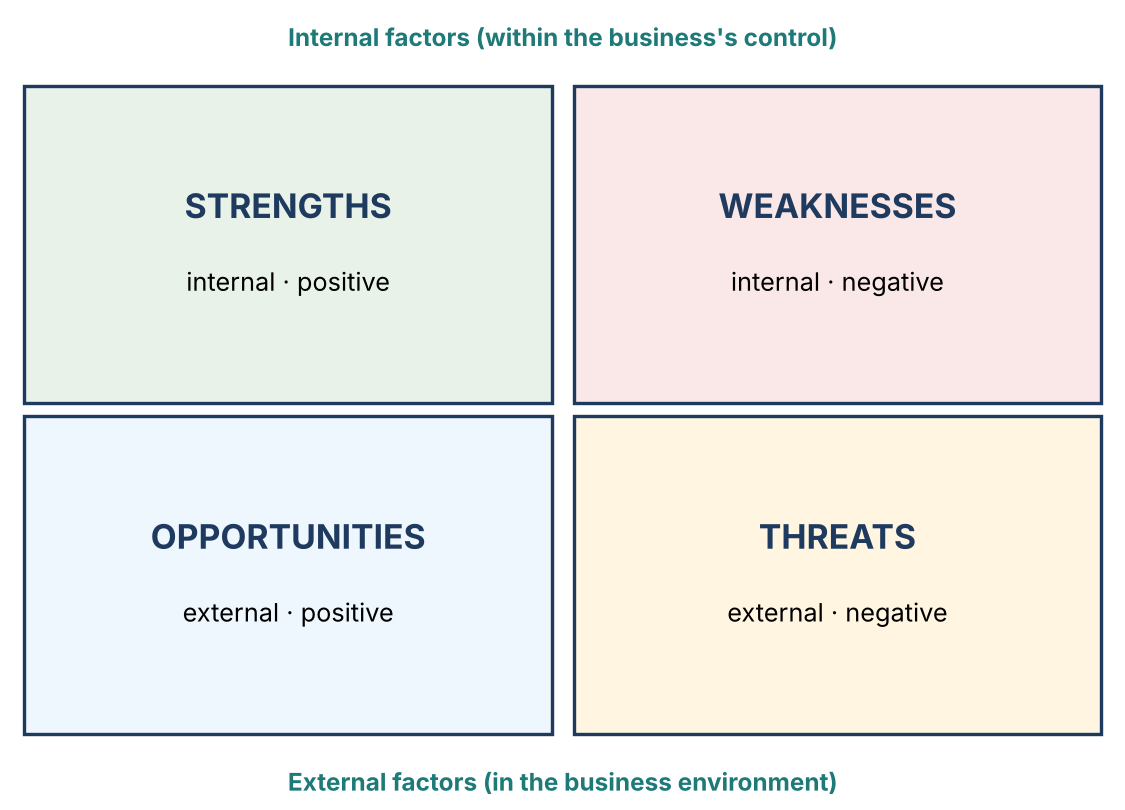
| Strengths (internal) | Weaknesses (internal) | Opportunities (external) | Threats (external) |
|---|---|---|---|
| Strong brand; loyal customers; low costs; skilled staff; patents; strong finances | Outdated products; high debt; poor location; weak online presence; skills gaps | Growing markets; new technology; trade agreements; rivals' weaknesses; changing tastes | New competitors; recession; rising costs; regulation; substitute products |
SWOT is most useful when it leads to strategy: using strengths to exploit opportunities, and fixing weaknesses that expose the business to threats. Limitations: it is subjective, can become a long unprioritised list, and is only a snapshot of one moment.
PEST provides the detail behind the 'opportunities' and 'threats' in SWOT, drawing on the external influences in Topic 6.1. Its value depends on identifying the few factors that really matter to the business and estimating their likely impact — not on listing everything.
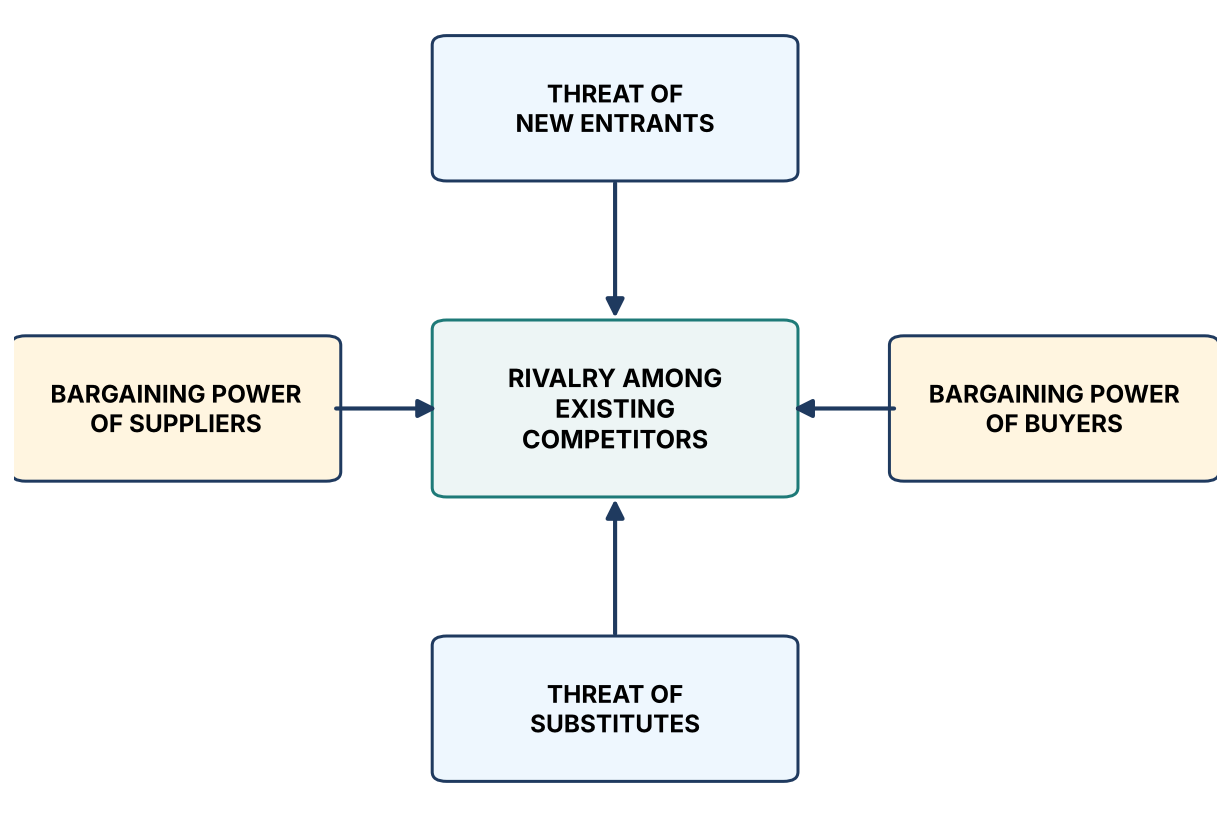
| Force | Strong (bad for profitability) when… |
|---|---|
| Rivalry among existing competitors | Many similar-sized rivals; slow market growth; products are similar; high fixed costs; high exit barriers |
| Threat of new entrants | Low barriers to entry — little capital needed, no economies of scale, weak brand loyalty, easy access to distribution |
| Threat of substitutes | Close alternatives from other industries exist and customers can switch cheaply |
| Bargaining power of suppliers | Few suppliers; unique inputs; high costs of switching supplier |
| Bargaining power of buyers | Few, large buyers; products are standardised; buyers can easily switch or make the product themselves |
The framework encourages businesses to build strategy around what they do uniquely well — and to outsource activities that are not core (Topic 4.3.2). Examples: Honda's competence in engines (cars, motorcycles, generators, lawnmowers); Infosys's competence in large-scale IT project delivery; Amul's competence in dairy procurement from millions of farmers. Limitation: competences can become core rigidities when markets change — a strength in film photography became a weakness for Kodak.
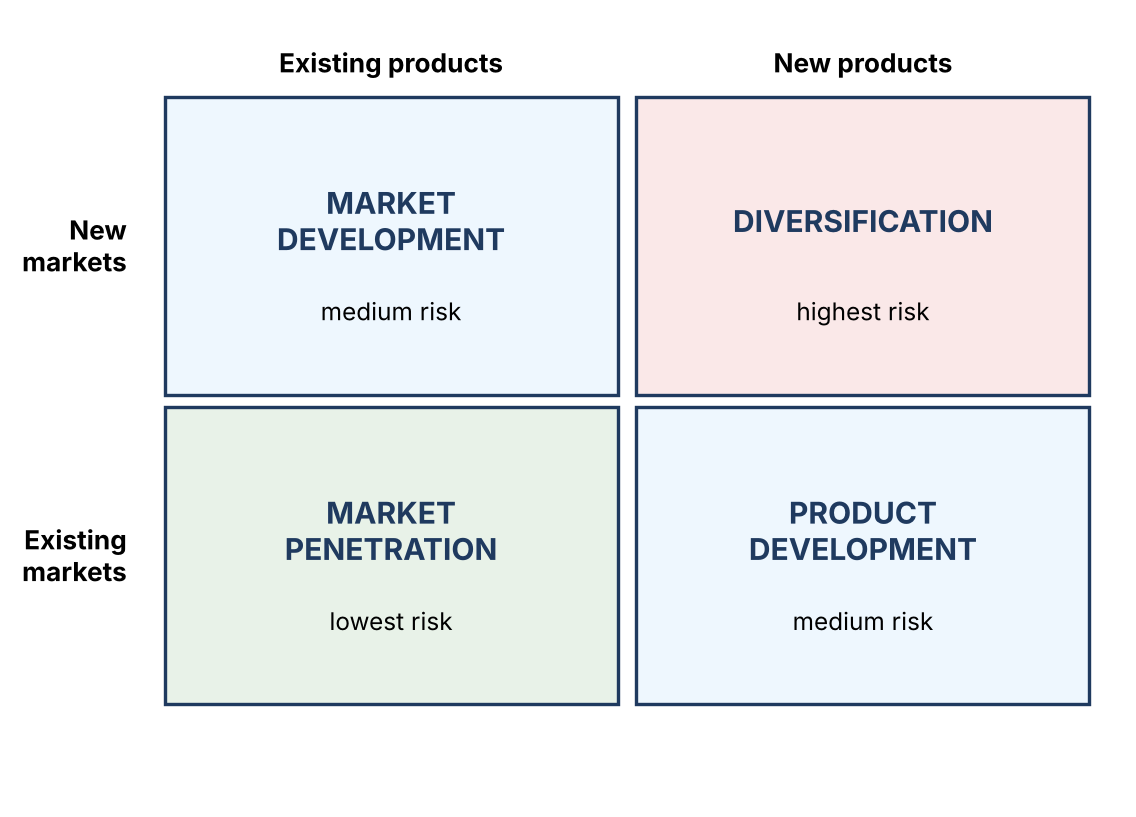
| Strategy | Meaning | Risk | Example |
|---|---|---|---|
| Market penetration | Selling more of existing products in existing markets (promotion, pricing, loyalty) | Lowest — known products and customers | Maggi promotions to increase consumption in India |
| Market development | Selling existing products in new markets (new countries or segments) | Medium — new customers | Indian IT firms entering new countries; Royal Enfield expanding in Europe and the USA |
| Product development | Selling new products in existing markets | Medium — new product | Tata Motors launching EVs to existing car buyers |
| Diversification | New products in new markets | Highest — both unknown | Reliance moving from petrochemicals into telecoms (Jio) and retail |
The matrix helps managers recognise the risk of each growth option. It does not say which option is best — that depends on the business's resources, the state of its current market and the competences it can transfer.
The key idea is value innovation: simultaneously offering buyers a leap in value while lowering costs, by asking which industry factors to eliminate, reduce, raise and create. Cirque du Soleil eliminated circus animals and star performers (high cost) and created theatre-style storylines, attracting adult audiences willing to pay more. Nintendo's Wii targeted non-gamers with motion controls instead of competing on graphics. In India, Zerodha created a mass market of first-time retail investors with low-cost online broking. Limitation: blue oceans attract imitators and eventually turn red.
Scenarios might cover different oil prices, economic conditions, technologies or regulations. The business can test its strategy against each, identify early-warning signs, and prepare responses — making it more resilient to uncertainty. Shell famously used scenario planning to respond quickly to the 1973 oil crisis. Limitations: time-consuming, and no set of scenarios can cover every possibility.
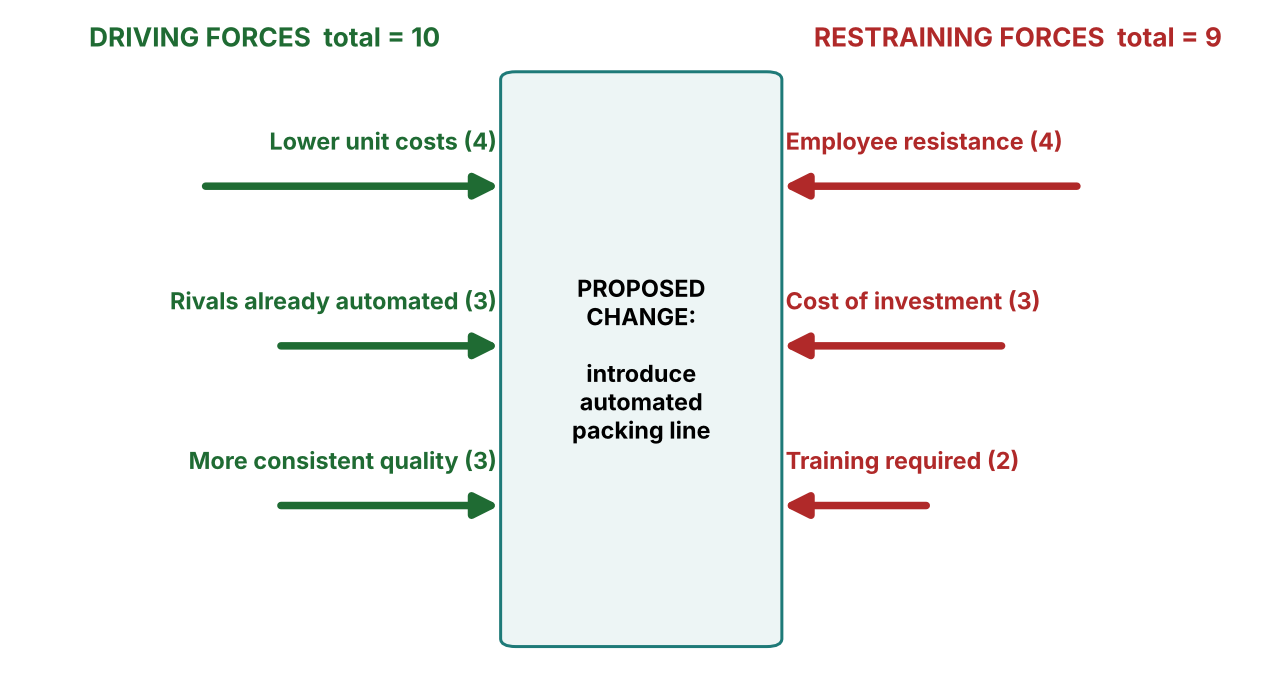
In Figure 4, the driving forces total 10 and the restraining forces 9, so the change is likely to succeed — but only narrowly. Managers can increase the chance of success by strengthening driving forces or, often more effectively, by weakening restraining forces: for example, reducing employee resistance through consultation, retraining guarantees and clear communication. Limitation: the scores are subjective estimates.
Expected value = the sum of (probability of each outcome × its financial result).
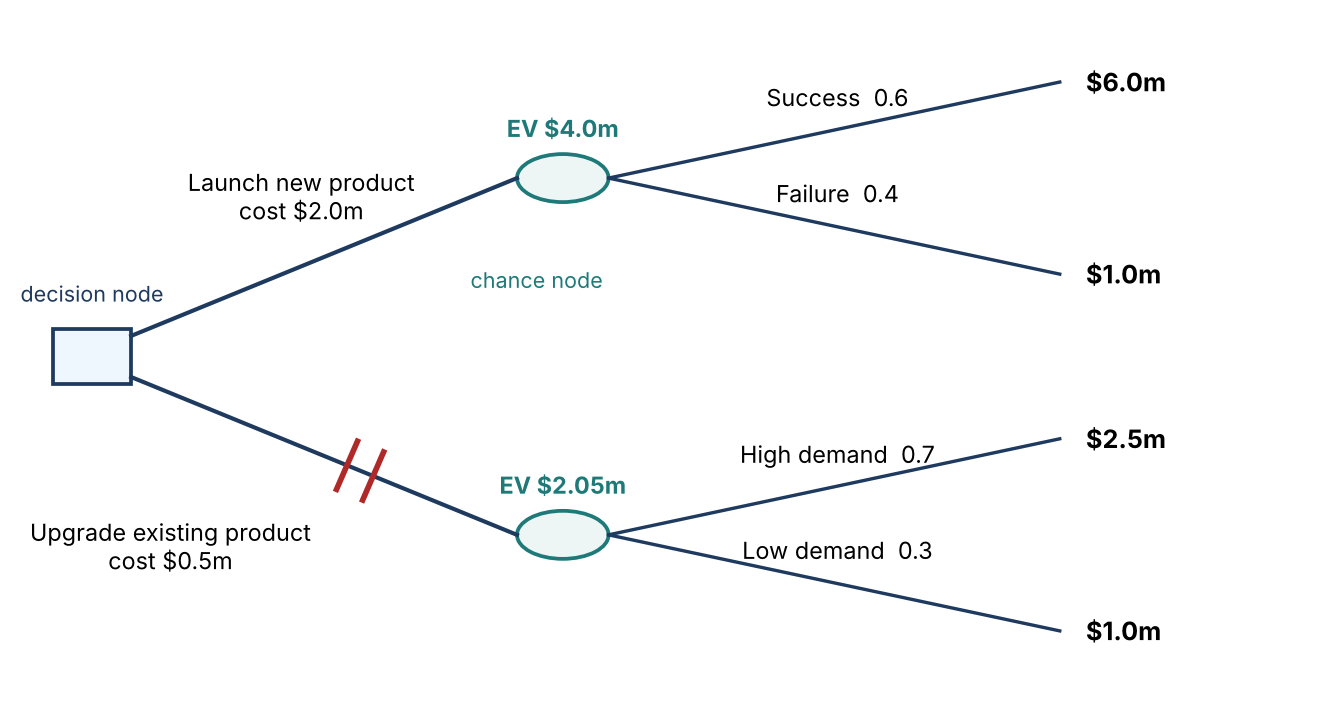
Squares are decision nodes; circles are chance nodes. Probabilities at each chance node must add up to 1.
Launch new product: EV = (0.6 × $6.0m) + (0.4 × $1.0m) = 3.6 + 0.4 = $4.0m; net = 4.0 − 2.0 cost = $2.0m
Upgrade existing product: EV = (0.7 × $2.5m) + (0.3 × $1.0m) = 1.75 + 0.3 = $2.05m; net = 2.05 − 0.5 = $1.55m
On financial grounds the business should launch the new product (net EV $2.0m > $1.55m). The rejected option is marked with two lines (//).
| Benefits of decision trees | Limitations |
|---|---|
| Set out options and outcomes clearly, forcing logical thinking | Probabilities and financial outcomes are estimates — often subjective |
| Quantify risk and allow options to be compared | Expected values are averages: the actual outcome will be one branch, not the EV |
| Encourage managers to consider all possible outcomes | Ignore qualitative factors (staff, brand, ethics) and attitudes to risk |
| Useful where reasonable data exists from past experience | Can become complex; quickly out of date |
Note that the new product carries greater risk: there is a 40% chance of receiving only $1.0m after spending $2.0m — a net loss of $1.0m. A risk-averse business with weak finances might rationally choose the upgrade despite its lower expected value.
- 6.2.2 Corporate planning and implementation
- Exam practice: 5 practice questions
- 2 exemplar answers with full model answers and mark breakdowns
- Where students commonly lose marks